Answered step by step
Verified Expert Solution
Question
1 Approved Answer
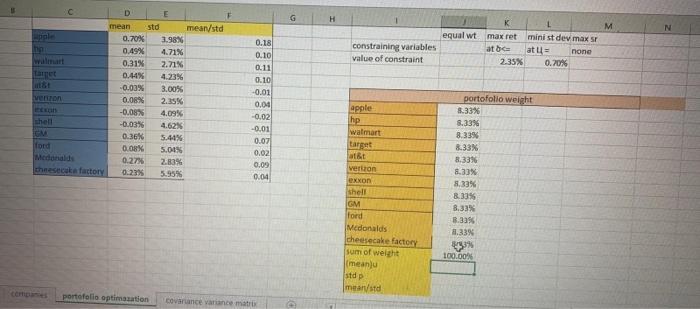
calculate portfolio weight G H M N equal wt constraining variables value of constraint max ret minist dev maxsr ato at 1 none 2.35% 0.20%

calculate portfolio weight
G H M N equal wt constraining variables value of constraint max ret minist dev maxsr ato at 1 none 2.35% 0.20% D E mean std mean/std 0.70% 3.98% 0.49% 4.71% 0.31% 2.71% 0.44% 4.23% -0.03% 3.00% enton 0.08% 2.35% -0.08% 4.09% shell -0.03% 4.62% 0.36% 5.41% lord 0.08 5.01% 0.27% 2.83% cheesecake factory 0.23% 5.95% 0.18) 0.10 0.11 0.10 -0.01 0,04 -0.02 -0.01 0.07 0.02 0.09 0.04 apple hp walmart target att verton exxon (shell GM Ford Medonalds cheesecake factory sum of weight (meany std p means portofolio weight 8.33% 8.33% 8.33% 8.33% 8.33% 8.33% 8.33% 8.33% 8.33% 3.33% 11.33% 100.00 portofolio optimaation covariance variance mar G H M N equal wt constraining variables value of constraint max ret minist dev maxsr ato at 1 none 2.35% 0.20% D E mean std mean/std 0.70% 3.98% 0.49% 4.71% 0.31% 2.71% 0.44% 4.23% -0.03% 3.00% enton 0.08% 2.35% -0.08% 4.09% shell -0.03% 4.62% 0.36% 5.41% lord 0.08 5.01% 0.27% 2.83% cheesecake factory 0.23% 5.95% 0.18) 0.10 0.11 0.10 -0.01 0,04 -0.02 -0.01 0.07 0.02 0.09 0.04 apple hp walmart target att verton exxon (shell GM Ford Medonalds cheesecake factory sum of weight (meany std p means portofolio weight 8.33% 8.33% 8.33% 8.33% 8.33% 8.33% 8.33% 8.33% 8.33% 3.33% 11.33% 100.00 portofolio optimaation covariance variance mar Step by Step Solution
There are 3 Steps involved in it
Step: 1

Get Instant Access to Expert-Tailored Solutions
See step-by-step solutions with expert insights and AI powered tools for academic success
Step: 2

Step: 3

Ace Your Homework with AI
Get the answers you need in no time with our AI-driven, step-by-step assistance
Get Started


