

Answered step by step
Verified Expert Solution
Question
1 Approved Answer
calculate return on assets return on common equity gross profit margin operating profit margin net profit margin return om capital emplyed total debt to equity
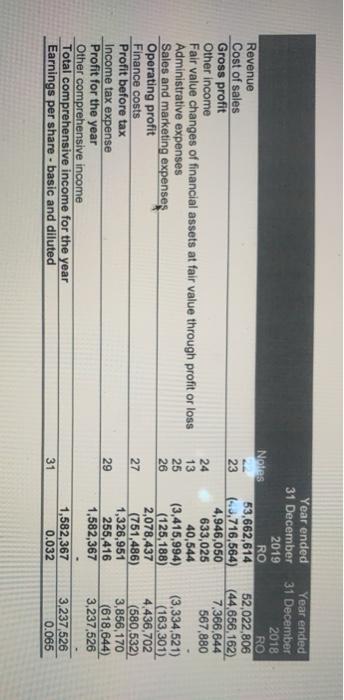
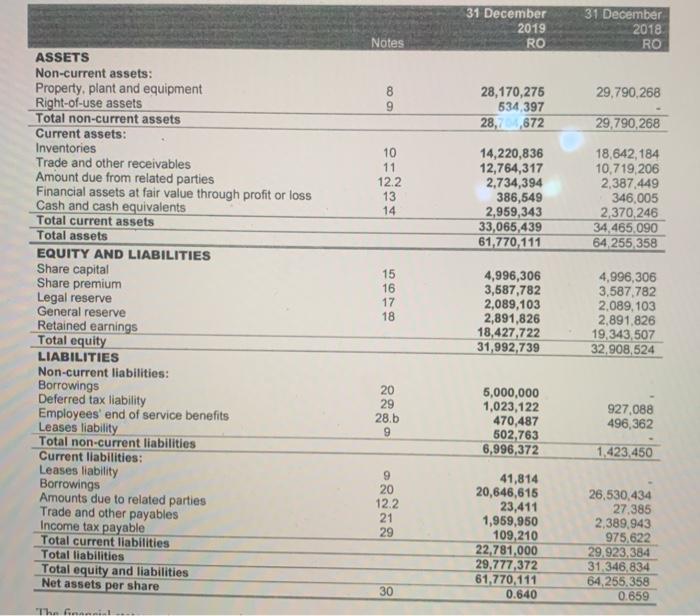
calculate return on assets
return on common equity
gross profit margin
operating profit margin
net profit margin
return om capital emplyed
total debt to equity
times interest earned
debt to asset ratio
financial leverage
long term debt to equity
inventory turnover ratio
total assets turnover ratio
fixed assets turnover ratio
accounts reciveable turnover ratio
Step by Step Solution
There are 3 Steps involved in it
Step: 1

Get Instant Access to Expert-Tailored Solutions
See step-by-step solutions with expert insights and AI powered tools for academic success
Step: 2

Step: 3
Ace Your Homework with AI
Get the answers you need in no time with our AI-driven, step-by-step assistance
Get Started
The Sterling Bonds And Fixed Income Handbook
Authors: Mark Glowrey
1st Edition
0857190423, 978-0857190420