Calculate return on common equity and return on equity.
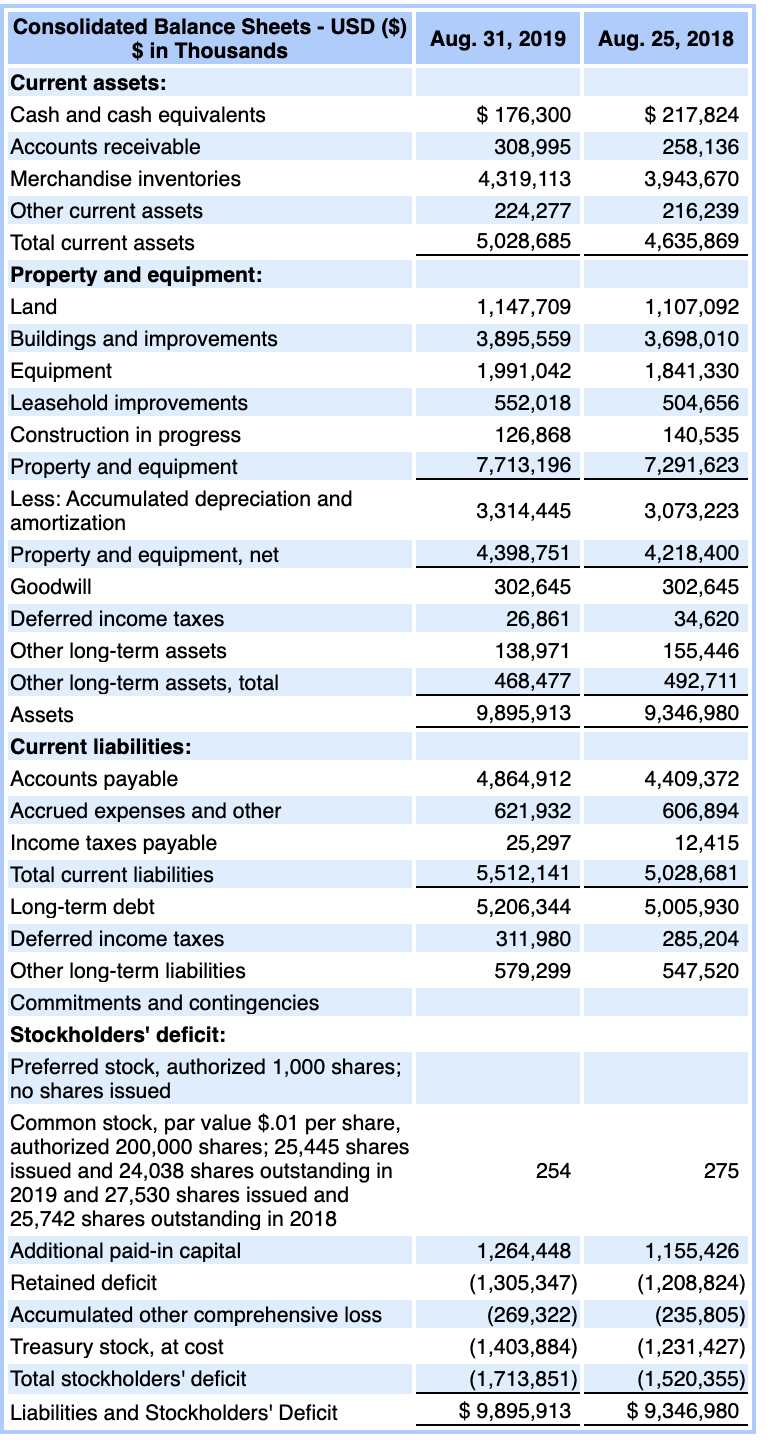
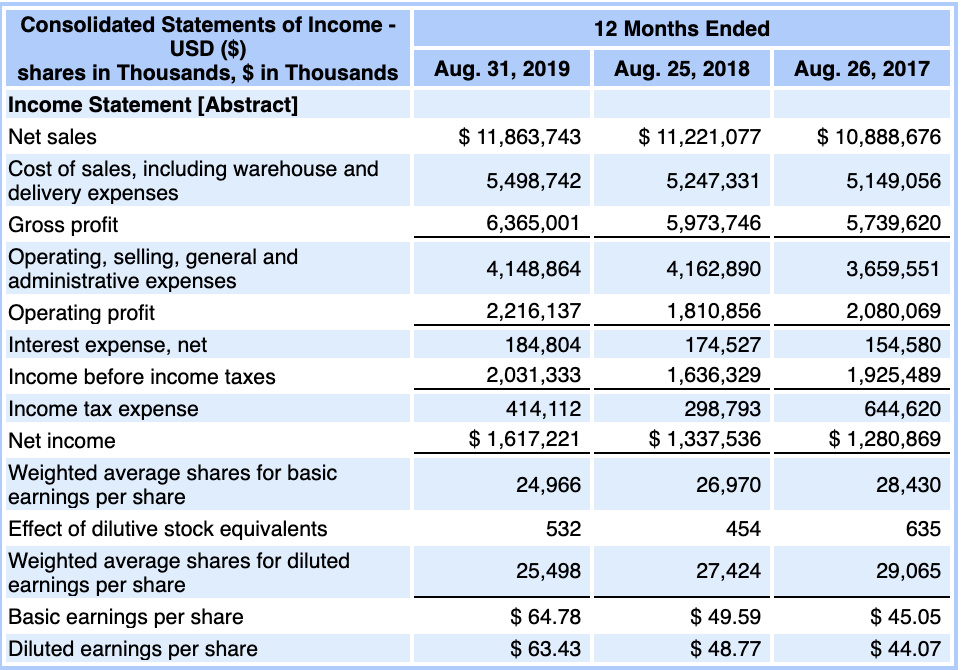
Aug. 31, 2019 Aug. 25, 2018 $ 176,300 308,995 4,319,113 224,277 5,028,685 $ 217,824 258,136 3,943,670 216,239 4,635,869 1,147,709 3,895,559 1,991,042 552,018 126,868 7,713,196 1,107,092 3,698,010 1,841,330 504,656 140,535 7,291,623 3,314,445 3,073,223 Consolidated Balance Sheets - USD ($) $ in Thousands Current assets: Cash and cash equivalents Accounts receivable Merchandise inventories Other current assets Total current assets Property and equipment: Land Buildings and improvements Equipment Leasehold improvements Construction in progress Property and equipment Less: Accumulated depreciation and amortization Property and equipment, net Goodwill Deferred income taxes Other long-term assets Other long-term assets, total Assets Current liabilities: Accounts payable Accrued expenses and other Income taxes payable Total current liabilities Long-term debt Deferred income taxes Other long-term liabilities Commitments and contingencies Stockholders' deficit: Preferred stock, authorized 1,000 shares; no shares issued Common stock, par value $.01 per share, authorized 200,000 shares; 25,445 shares issued and 24,038 shares outstanding in 2019 and 27,530 shares issued and 25,742 shares outstanding in 2018 Additional paid-in capital Retained deficit Accumulated other comprehensive loss Treasury stock, at cost Total stockholders' deficit Liabilities and Stockholders' Deficit 4,398,751 302,645 26,861 138,971 468,477 9,895,913 4,218,400 302,645 34,620 155,446 492,711 9,346,980 4,864,912 621,932 25,297 5,512,141 5,206,344 311,980 579,299 4,409,372 606,894 12,415 5,028,681 5,005,930 285,204 547,520 254 275 1,264,448 (1,305,347) (269,322) (1,403,884) (1,713,851) $ 9,895,913 1,155,426 (1,208,824) (235,805) (1,231,427) (1,520,355) $ 9,346,980 12 Months Ended Aug. 31, 2019 Aug. 25, 2018 Aug. 26, 2017 $ 11,863,743 $ 11,221,077 $ 10,888,676 5,498,742 5,247,331 5,149,056 6,365,001 5,973,746 5,739,620 4,148,864 4,162,890 3,659,551 Consolidated Statements of Income - USD ($) shares in Thousands, $ in Thousands Income Statement [Abstract] Net sales Cost of sales, including warehouse and delivery expenses Gross profit Operating, selling, general and administrative expenses Operating profit Interest expense, net Income before income taxes Income tax expense Net income Weighted average shares for basic earnings per share Effect of dilutive stock equivalents Weighted average shares for diluted earnings per share Basic earnings per share Diluted earnings per share 2,216,137 184,804 2,031,333 414,112 $ 1,617,221 1,810,856 174,527 1,636,329 298,793 $ 1,337,536 2,080,069 154,580 1,925,489 644,620 $ 1,280,869 24,966 26,970 28,430 532 454 635 25,498 27,424 29,065 $ 64.78 $ 63.43 $ 49.59 $ 48.77 $ 45.05 $ 44.07