Answered step by step
Verified Expert Solution
Question
1 Approved Answer
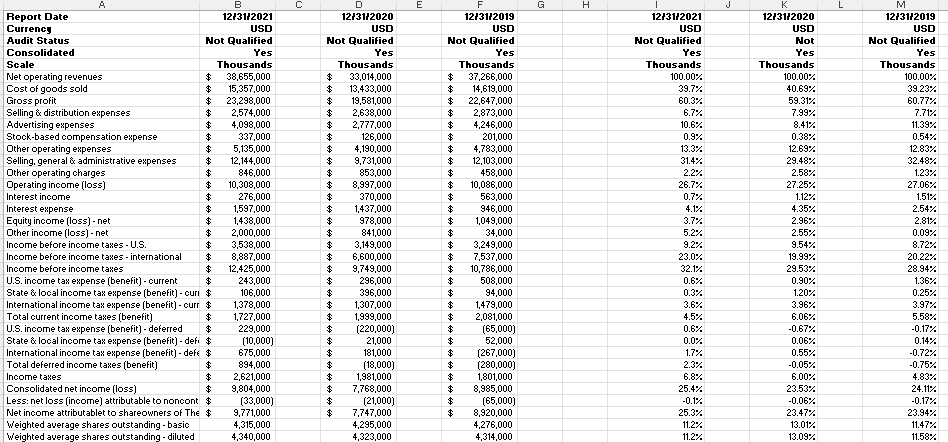
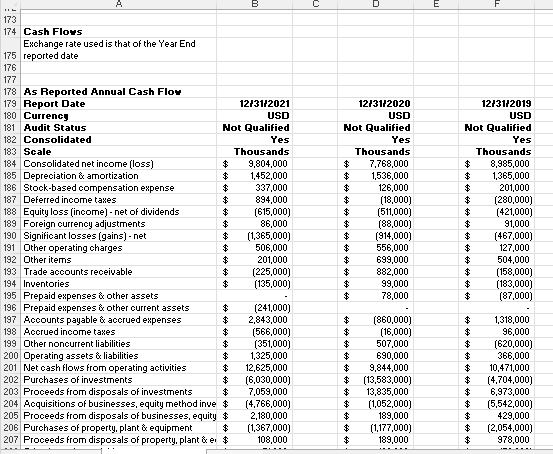
Calculate simple cash flow for the past 3 years. Summarize the trend in simple cash flow for the past 3 years. Compare the simple cash
Calculate simple cash flow for the past 3 years.
- Summarize the trend in simple cash flow for the past 3 years.
- Compare the simple cash flow to the net operating cash flow from the statement of cash flows for the past 3 years.
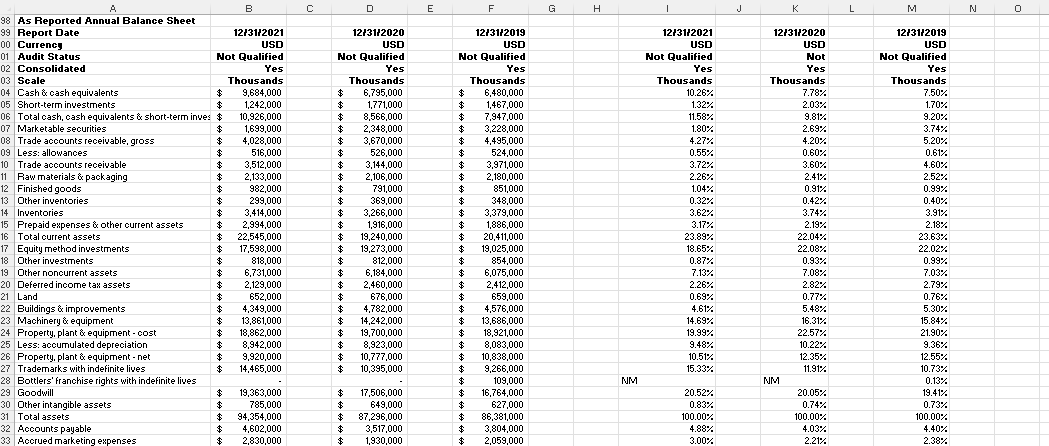
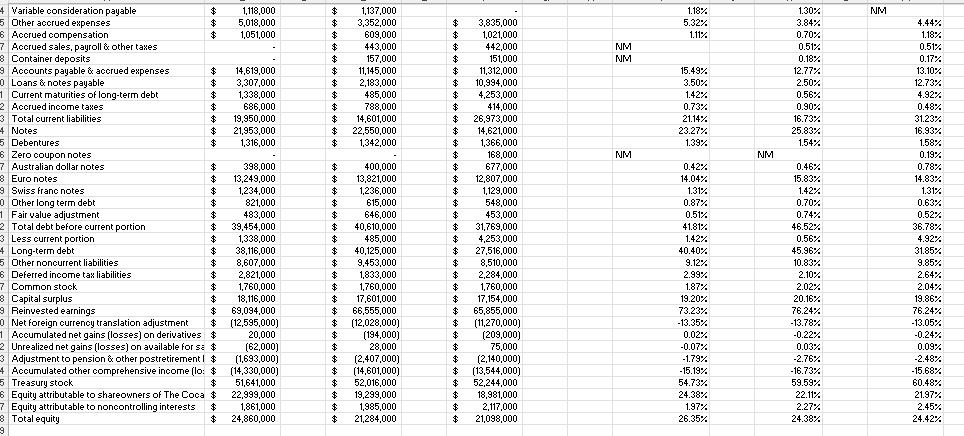
- Determine the strengths and weaknesses of the company based primarily on the trends in items discussed from the income statements, balance sheets, common size income statements, and common size balance sheets, as well as the comments on cash flow.
- a table that indicates whether each financial fact is a strength or a weakness.
- Determine the overall financial strength of the company based on the financial facts included as strengths or weaknesses.
- Categorize the overall financial performance of the company as strong, neutral, or weak.
- Justify your conclusion based on the table you created.


A Report Date Currency Audit Status Consolidated Scale Net operating revenues Cost of goods sold Gross profit Selling & distribution expenses B 12/31/2021 Not Qualified Thousands C D USD 12/31/2020 Not Qualified E F G H 12/31/2019 USD USD Yes Yes Thousands Not Qualified Yes Thousands 12/31/2021 USD Not Qualified K 12/31/2020 L M 12/31/2019 USD USD Not Not Qualified Yes Yes Yes Thousands Thousands Thousands $ 38,655,000 $ 33,014,000 $ 37,266,000 100.00% 100.00% 100.00% $ 15,357,000 $ 13,433,000 $ 14,619,000 39.7% 40.69% 39.23% $ 23,298,000 $ 19,581,000 $ 22,647,000 60.3% 59.31% 60.77% $ 2,574,000 $ 2,638,000 $ 2,873,000 6.7% 7.99% 7.71% Advertising expenses $ 4,098,000 $ 2,777,000 $ 4,246,000 10.6% 8.41% 11.39% Stock-based compensation expense $ 337,000 $ 126,000 $ 201,000 0.9% 0.38% 0.54% Other operating expenses $ 5,135,000 $ 4,190,000 $ 4,783,000 13.3% 12.69% 12.83% Selling, general & administrative expenses $ 12,144,000 $ 9,731,000 $ 12,103,000 31.4% 29.48% 32.48% Other operating charges $ 846,000 $ 853,000 $ 458,000 2.2% 2.58% 1.23% Operating income (loss) $ 10,308,000 $ 8,997,000 $ 10,086,000 26.7% 27.25% 27.06% Interest income $ 276,000 $ 370,000 $ 563,000 0.7% 1.12% 1.51% Interest expense $ 1,597,000 $ 1,437,000 $ 946,000 4.1% 4.35% 2.54% Equity income (loss) - net $ 1,438,000 $ 978,000 $ 1,049,000 3.7% 2.96% 2.81% Other income (loss) - net $ 2,000,000 $ 841,000 $ 34,000 5.2% 2.55% 0.09% Income before income taxes - U.S. $ 3,538,000 $ 3,149,000 $ 3,249,000 9.2% 9.54% 8.72% Income before income taxes - international $ 8,887,000 $ 6,600,000 $ 7,537,000 23.0% 19.99% 20.22% Income before income taxes $ 12,425,000 $ 9,749,000 $ 10,786,000 32.1% 29.53% 28.94% U.S. income tax expense (benefit) - current $ 243,000 $ 296,000 $ 508,000 0.6% 0.90% 1.36% State & local income tax expense (benefit) - curi $ 106,000 $ 396,000 $ 94,000 0.3% 1.20% 0.25% International income tax expense (benefit) - ourr $ 1,378,000 $ 1,307,000 $ 1,479,000 3.6% 3.96% 3.97% Total current income taxes (benefit) $ 1,727,000 $ 1,999,000 $ 2,081,000 4.5% 6.06% 5.58% U.S. income tax expense (benefit) - deferred $ 229,000 $ (220,000) $ (65,000) 0.6% -0.67% -0.17% State & local income tax expense (benefit) - defi $ (10,000) $ 21,000 $ 52,000 0.0% 0.06% 0.14% International income tax expense (benefit) - defe $ Total deferred income taxes (benefit) 675,000 $ 181,000 $ (267,000) 1.7% 0.55% -0.72% $ 894,000 $ (18,000) $ (280,000) 2.3% -0.05% -0.75% Income taxes $ 2,621,000 $ 1,981,000 $ 1,801,000 6.8% 6.00% 4.83% Consolidated net income (loss) $ 9,804,000 $ 7,768,000 $ 8,985,000 25.4% 23.53% 24.11% Less: net loss (income) attributable to noncont $ (33,000) $ (21,000) $ (65,000) -0.1% -0.06% -0.17% Net income attributablet to shareowners of The $ 9,771,000 $ 7,747,000 $ 8,920,000 25.3% 23.47% 23.94% Weighted average shares outstanding - basic Weighted average shares outstanding - diluted 4,315,000 4,295,000 4,276,000 11.2% 13.01% 11.47% 4,340,000 4,323,000 4,314,000 11.2% 13.09% 11.58%
Step by Step Solution
There are 3 Steps involved in it
Step: 1

Get Instant Access to Expert-Tailored Solutions
See step-by-step solutions with expert insights and AI powered tools for academic success
Step: 2

Step: 3

Ace Your Homework with AI
Get the answers you need in no time with our AI-driven, step-by-step assistance
Get Started


