Answered step by step
Verified Expert Solution
Question
1 Approved Answer
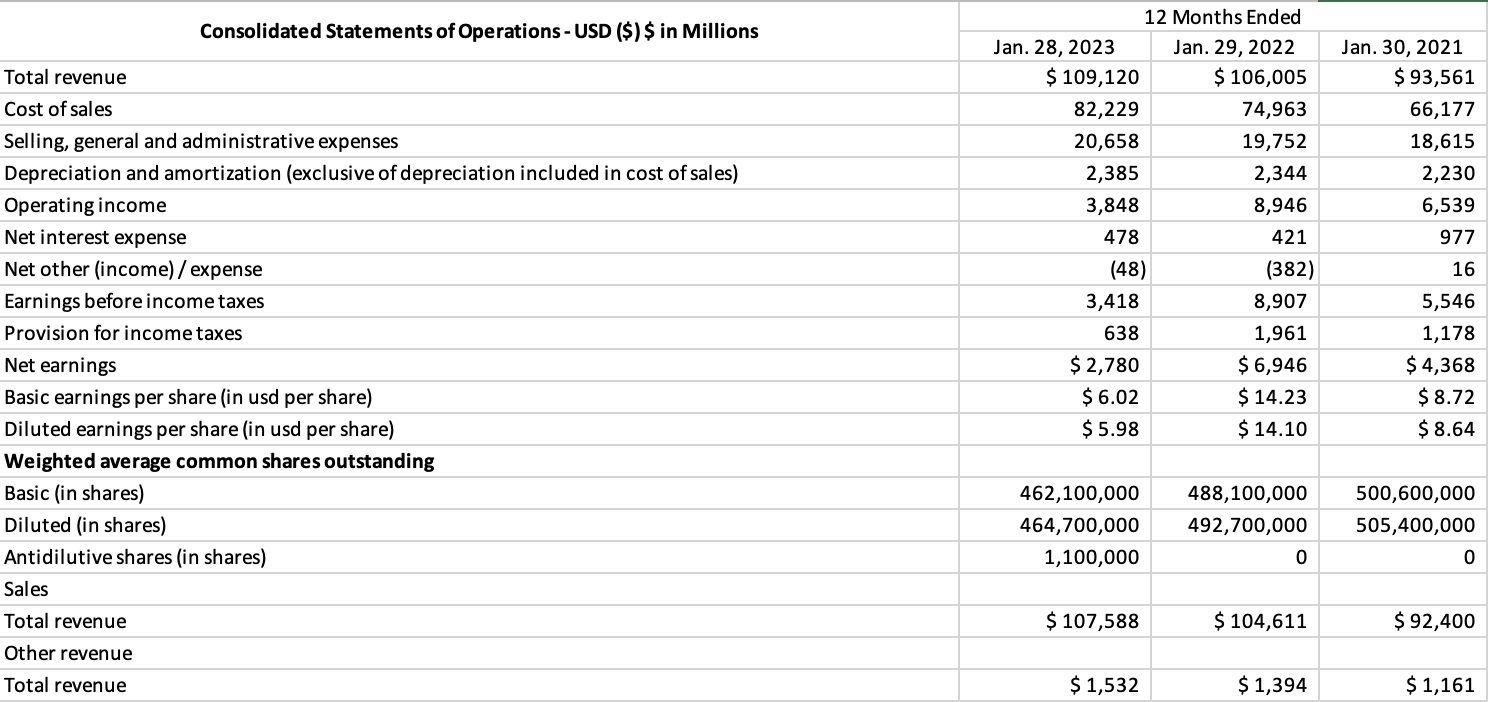
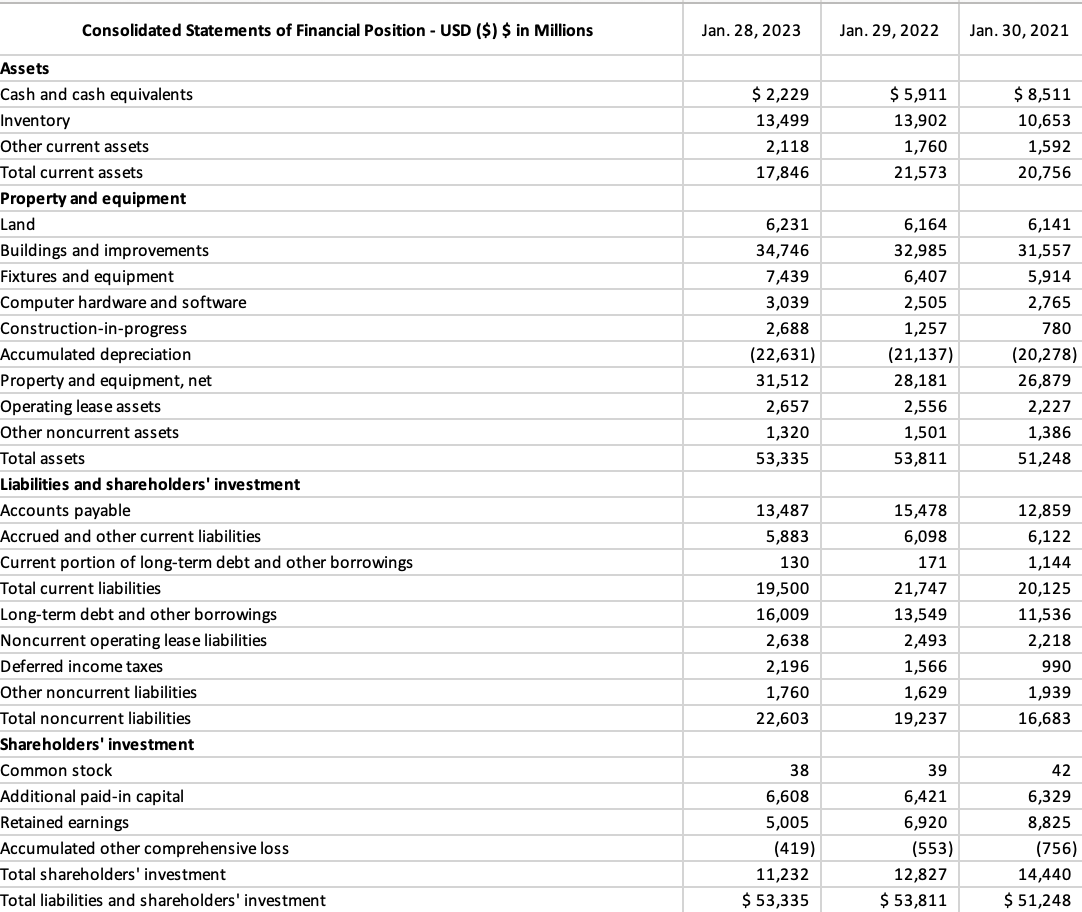
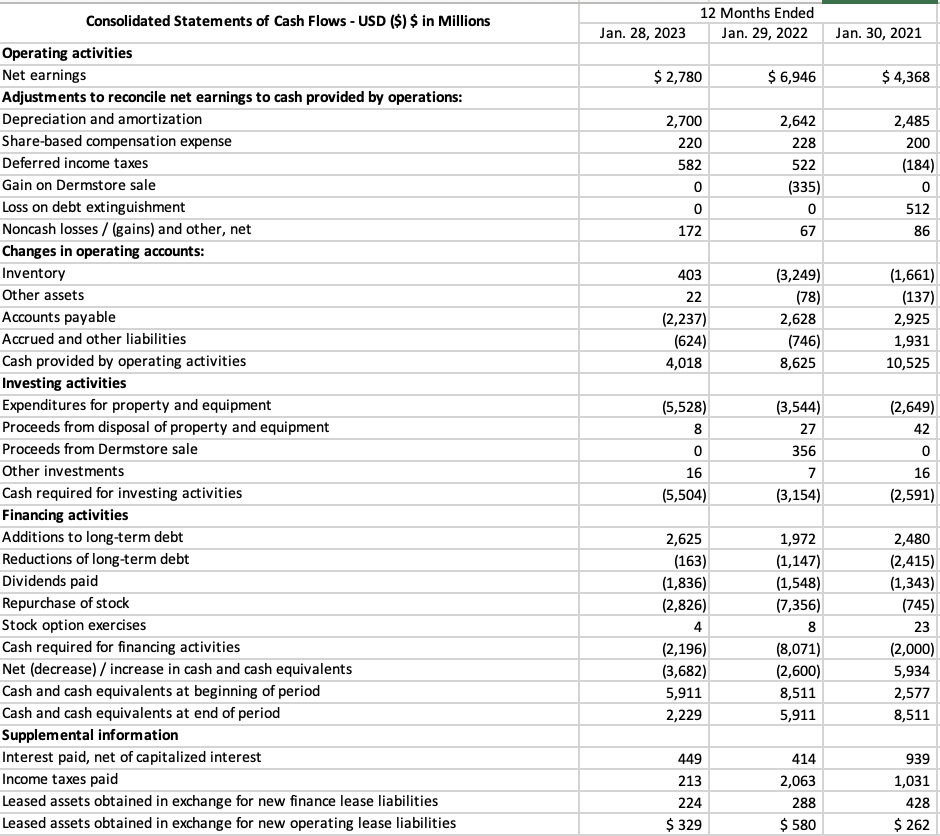
Calculate Target's DuPont Chart for fiscal 2022. Consolidated Statements of Operations-USD ($)$ in Millions Total revenue Cost of sales Selling, general and administrative expenses Depreciation
Calculate Target's DuPont Chart for fiscal 2022.


Consolidated Statements of Operations-USD ($)$ in Millions Total revenue Cost of sales Selling, general and administrative expenses Depreciation and amortization (exclusive of depreciation included in cost of sales) Operating income Net interest expense Net other (income)/expense Earnings before income taxes Provision for income taxes Net earnings Basic earnings per share (in usd per share) Diluted earnings per share (in usd per share) Weighted average common shares outstanding Basic (in shares) Diluted (in shares) Antidilutive shares (in shares) Sales Total revenue Other revenue Total revenue Jan. 28, 2023 $ 109,120 12 Months Ended Jan. 29, 2022 $106,005 Jan. 30, 2021 $93,561 82,229 74,963 66,177 20,658 19,752 18,615 2,385 2,344 2,230 3,848 8,946 6,539 478 421 977 (48) (382) 16 3,418 8,907 5,546 638 1,961 1,178 $2,780 $ 6,946 $4,368 $6.02 $ 14.23 $8.72 $5.98 $ 14.10 $8.64 462,100,000 488,100,000 464,700,000 492,700,000 500,600,000 505,400,000 1,100,000 0 0 $107,588 $ 104,611 $92,400 $1,532 $ 1,394 $1,161
Step by Step Solution
There are 3 Steps involved in it
Step: 1

Get Instant Access to Expert-Tailored Solutions
See step-by-step solutions with expert insights and AI powered tools for academic success
Step: 2

Step: 3

Ace Your Homework with AI
Get the answers you need in no time with our AI-driven, step-by-step assistance
Get Started


