Calculate the 8 variances we learned this week using the data from below
Notes to help:
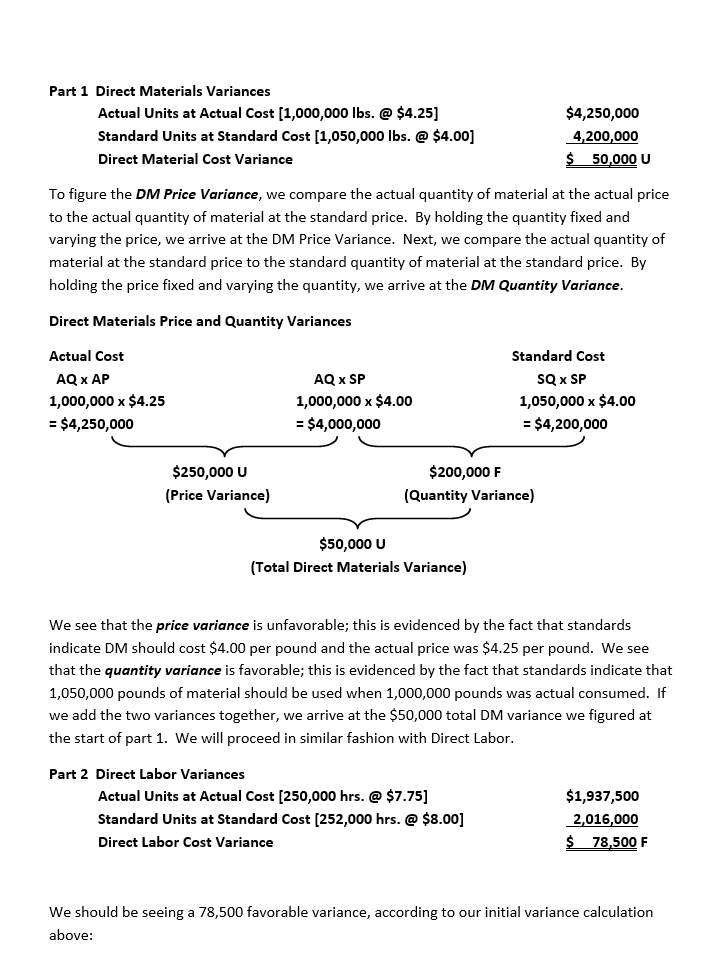
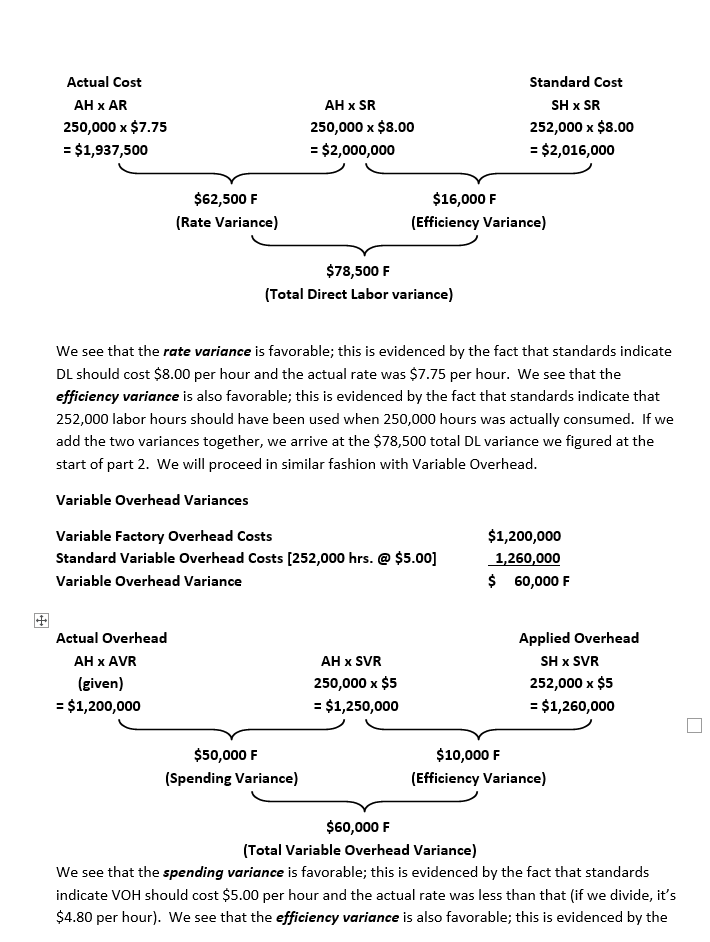
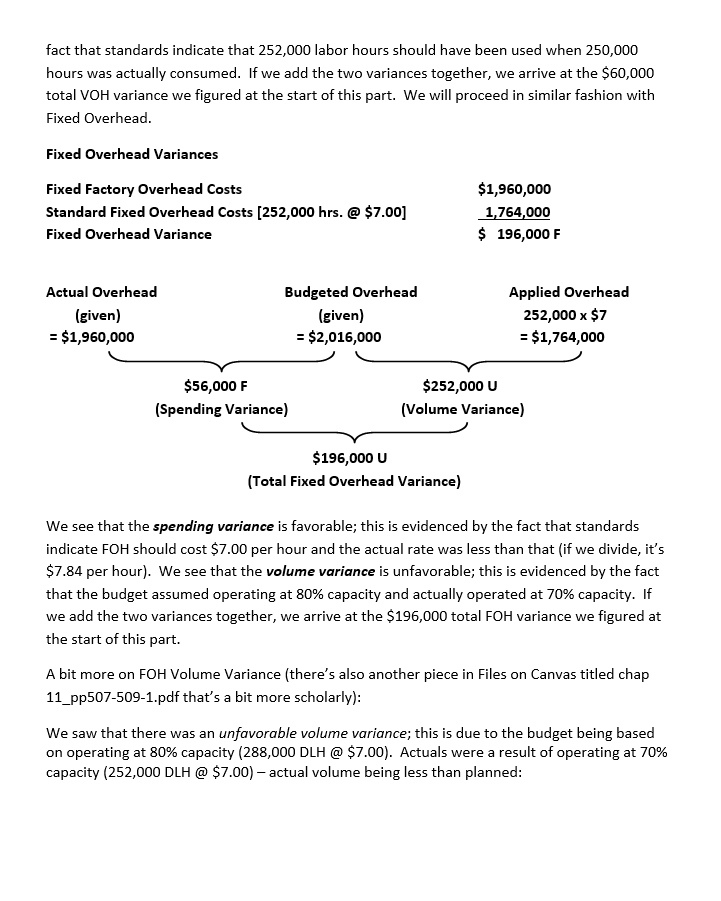
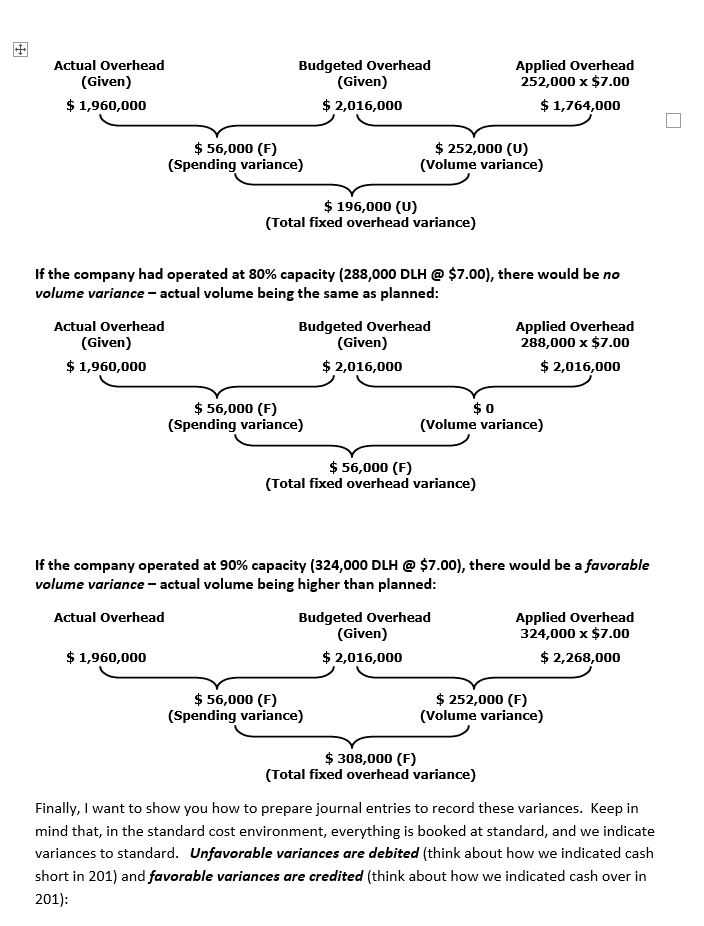
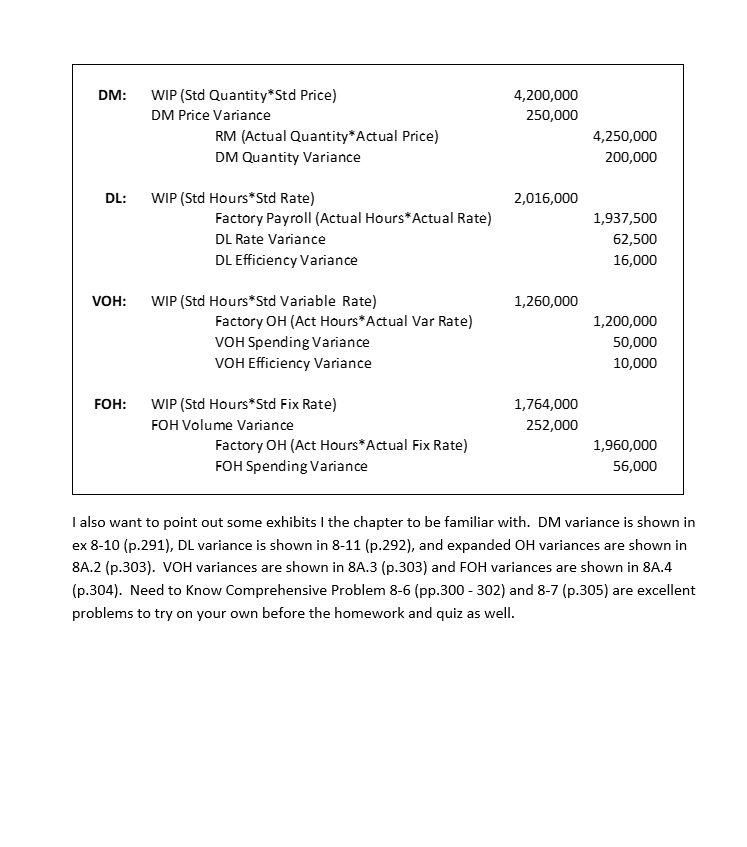
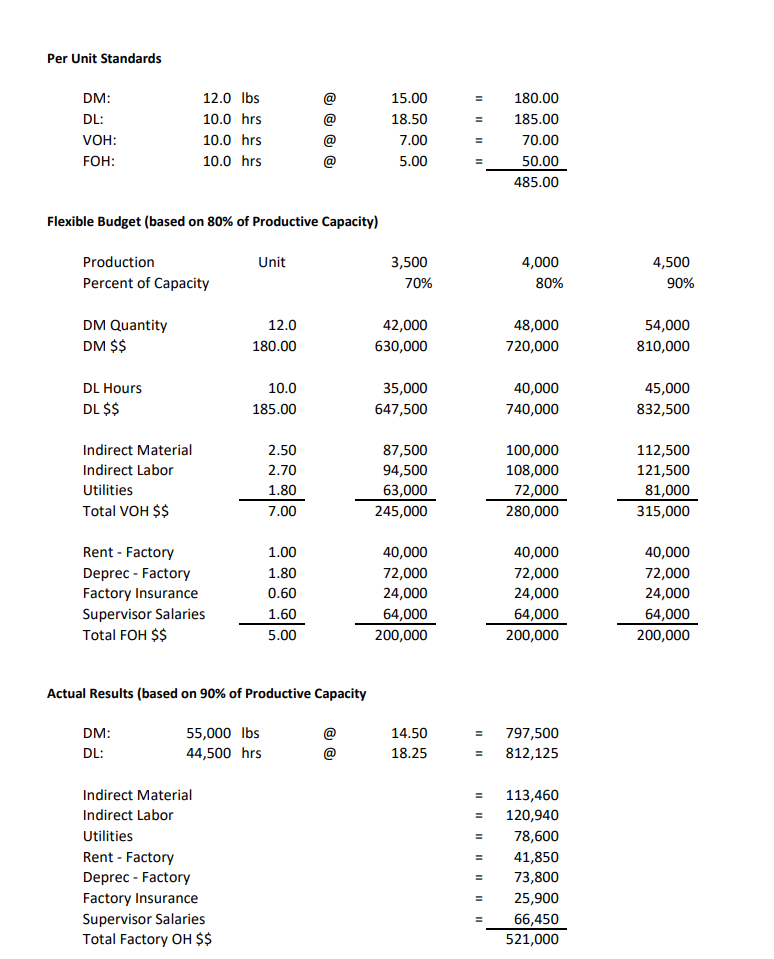
Per Unit Standards @ = DM: DL: VOH: FOH: 12.0 lbs 10.0 hrs 10.0 hrs 10.0 hrs 15.00 18.50 7.00 5.00 180.00 185.00 70.00 50.00 485.00 Flexible Budget (based on 80% of Productive Capacity) Unit Production Percent of Capacity 3,500 70% 4,000 80% 4,500 90% DM Quantity DM $$ 12.0 180.00 42,000 630,000 48,000 720,000 54,000 810,000 DL Hours DL $$ 10.0 185.00 35,000 647,500 40,000 740,000 45,000 832,500 Indirect Material Indirect Labor Utilities Total VOH $$ 2.50 2.70 1.80 7.00 87,500 94,500 63,000 245,000 100,000 108,000 72,000 280,000 112,500 121,500 81,000 315,000 Rent - Factory Deprec - Factory Factory Insurance Supervisor Salaries Total FOH $$ 1.00 1.80 0.60 1.60 5.00 40,000 72,000 24,000 64,000 200,000 40,000 72,000 24,000 64,000 200,000 40,000 72,000 24,000 64,000 200,000 Actual Results (based on 90% of Productive Capacity DM: @ 55,000 lbs 44,500 hrs 14.50 18.25 DL: 797,500 812,125 = Il Indirect Material Indirect Labor Utilities Rent - Factory Deprec - Factory Factory Insurance Supervisor Salaries Total Factory OH $$ 113,460 120,940 78,600 41,850 73,800 25,900 66,450 521,000 = Last chapter, we examined budgeting practices. This chapter, we will be looking at ways to examine actual performance as compared to budget. Two main things will be covered: the Flexible Budget and Standard Costing. Look at exhibit 8.2 (p.284) - a fixed budget performance report. We can see that sales exceeded what was planned (12,000 units over 10,000 units) for a favorable variance. The next several items, however, show unfavorable variances. But, are these really unfavorable? If we sell more than planned, we'd expect to use more Direct Materials (DM) than planned, more Direct Labor (DL) than planned, more Factory Supplies than planned, more Utilities than planned, and so on. To help us have a better time reporting performance, we can use something from chapters 5 and 6: Contribution Margin format. Exhibit 8.3 (p.285) shows the same information as exhibit 8.2, with the inclusion of two extra activity levels 12,000 and 14,000 units. Using this flexible budget, we are able to compare better to the actual 12,000 units. Whereas with the fixed budget report showed 11,600 in unfavorable variances and total variance of 13,400 favorable), the flexible budget performance report, exhibit 8.4 (p.286) shows a 3,000 favorable variance. Some companies use these flexible budgets to cover the best case, likely case and worst case scenarios in one planning document. Whatever the motivation, I am sure you can see the advantages of using this format. Now, let's say you have - and I'm just making up numbers here -a 5,000 unfavorable DM variance showing on your performance report. Is this because more was spent on DM per unit than planned or was it a result of using a greater quantity of DM than planned? Same thing with DL it is because the rate paid was higher than planned or because more DL hours (DLH) we used? This is where Standard Costing can help us. Together with industrial engineers, managerial accountants/finance departments create standards for DM (price and quantity), DL (rates and hours), Variable Overhead (VOH rates and hours) and Fixed Overhead (FOH rates and hours). We're going to use Problem 8-4B and 8-5B (p.322) to examine how to calculate and interpret these eight different variances. The problem starts by showing the per unit standards for DM, DL, VOH and FOH. Some of that information is used to complete the partial flexible budget in the second shaded area. We are told that the planned operating volume was 80% of the productive capacity of 60,000 units. Standards for that planned level follow in the third shaded area. Finally, we see the actual costs incurred and are told that the company operated at 70% of the productive capacity. I like to first figure the total DM variance then ensure that the two component variances add up to the total we figure here. Part 1 Direct Materials Variances Actual Units at Actual Cost (1,000,000 lbs. @ $4.25] $4,250,000 Standard Units at Standard Cost (1,050,000 lbs. @ $4.00] 4,200,000 Direct Material Cost Variance $ 50,000 u To figure the DM Price Variance, we compare the actual quantity of material at the actual price to the actual quantity of material at the standard price. By holding the quantity fixed and varying the price, we arrive at the DM Price Variance. Next, we compare the actual quantity of material at the standard price to the standard quantity of material at the standard price. By holding the price fixed and varying the quantity, we arrive at the DM Quantity Variance. Direct Materials Price and Quantity Variances Actual Cost Standard Cost AQ x AP AQ x SP SQ x SP 1,000,000 x $4.25 1,000,000 x $4.00 1,050,000 x $4.00 = $4,250,000 = $4,000,000 = $4,200,000 $250,000 u (Price Variance) $200,000 F (Quantity Variance) $50,000 u (Total Direct Materials Variance) We see that the price variance is unfavorable; this is evidenced by the fact that standards indicate DM should cost $4.00 per pound and the actual price was $4.25 per pound. We see that the quantity variance is favorable; this is evidenced by the fact that standards indicate that 1,050,000 pounds of material should be used when 1,000,000 pounds was actual consumed. If we add the two variances together, we arrive at the $50,000 total DM variance we figured at the start of part 1. We will proceed in similar fashion with Direct Labor. Part 2 Direct Labor Variances Actual Units at Actual Cost [250,000 hrs. @ $7.75] Standard Units at Standard Cost [252,000 hrs. @ $8.00] Direct Labor Cost Variance $1,937,500 2,016,000 $ 78,500 F We should be seeing a 78,500 favorable variance, according to our initial variance calculation above: Actual Cost AH XAR 250,000 x $7.75 = $1,937,500 AH x SR 250,000 x $8.00 = $2,000,000 Standard Cost SH SR 252,000 x $8.00 = $2,016,000 $62,500 F (Rate Variance) $16,000 F (Efficiency Variance) $78,500 F (Total Direct Labor variance) We see that the rate variance is favorable; this is evidenced by the fact that standards indicate DL should cost $8.00 per hour and the actual rate was $7.75 per hour. We see that the efficiency variance is also favorable; this is evidenced by the fact that standards indicate that 252,000 labor hours should have been used when 250,000 hours was actually consumed. If we add the two variances together, we arrive at the $78,500 total DL variance we figured at the start of part 2. We will proceed in similar fashion with Variable Overhead. Variable Overhead Variances Variable Factory Overhead Costs Standard Variable Overhead Costs [252,000 hrs. @ $5.00] Variable Overhead Variance $1,200,000 1,260,000 $ 60,000 F Actual Overhead AH X AVR (given) = $1,200,000 AH X SVR 250,000 x $5 = $1,250,000 Applied Overhead SH X SVR 252,000 $5 = $1,260,000 $50,000 F (Spending Variance) $10,000 F (Efficiency Variance) $60,000 F (Total Variable Overhead Variance) We see that the spending variance is favorable; this is evidenced by the fact that standards indicate VOH should cost $5.00 per hour and the actual rate was less than that (if we divide, it's $4.80 per hour). We see that the efficiency variance is also favorable; this is evidenced by the fact that standards indicate that 252,000 labor hours should have been used when 250,000 hours was actually consumed. If we add the two variances together, we arrive at the $60,000 total VOH variance we figured at the start of this part. We will proceed in similar fashion with Fixed Overhead. Fixed Overhead Variances Fixed Factory Overhead Costs Standard Fixed Overhead Costs [252,000 hrs. @ $7.00] Fixed Overhead Variance $1,960,000 1,764,000 $ 196,000 F Actual Overhead (given) = $1,960,000 Budgeted Overhead (given) = $2,016,000 Applied Overhead 252,000 x $7 = $1,764,000 $56,000 F (Spending Variance) $252,000 u (Volume Variance) $196,000 u (Total Fixed Overhead Variance) We see that the spending variance is favorable; this is evidenced by the fact that standards indicate FOH should cost $7.00 per hour and the actual rate was less than that (if we divide, it's $7.84 per hour). We see that the volume variance is unfavorable; this is evidenced by the fact that the budget assumed operating at 80% capacity and actually operated at 70% capacity. If we add the two variances together, we arrive at the $196,000 total FOH variance we figured at the start of this part. A bit more on FOH Volume Variance (there's also another piece in Files on Canvas titled chap 11_pp507-509-1.pdf that's a bit more scholarly): We saw that there was an unfavorable volume variance; this is due to the budget being based on operating at 80% capacity (288,000 DLH @ $7.00). Actuals were a result of operating at 70% capacity (252,000 DLH @ $7.00) actual volume being less than planned: Actual Overhead (Given) $ 1,960,000 Budgeted Overhead (Given) $ 2,016,000 Applied Overhead 252,000 x $7.00 $ 1,764,000 $ 56,000 (6) (Spending variance) $ 252,000 (U) (Volume variance) $ 196,000 (U) (Total fixed overhead variance) If the company had operated at 80% capacity (288,000 DLH @ $7.00), there would be no volume variance - actual volume being the same as planned: Actual Overhead Budgeted Overhead Applied Overhead (Given) (Given) 288,000 x $7.00 $ 1,960,000 $ 2,016,000 $ 2,016,000 $ 56,000 (F) (Spending variance) $0 (Volume variance) $ 56,000 (F) (Total fixed overhead variance) If the company operated at 90% capacity (324,000 DLH @ $7.00), there would be a favorable volume variance - actual volume being higher than planned: Actual Overhead Budgeted Overhead Applied Overhead (Given) 324,000 x $7.00 $ 1,960,000 $ 2,016,000 $ 2,268,000 $ 56,000 (F) (Spending variance) $ 252,000 (F) (Volume variance) $ 308,000 (F) (Total fixed overhead variance) Finally, I want to show you how to prepare journal entries to record these variances. Keep in mind that, in the standard cost environment, everything is booked at standard, and we indicate variances to standard. Unfavorable variances are debited (think about how we indicated cash short in 201) and favorable variances are credited (think about how we indicated cash over in 201): DM: 4,200,000 250,000 WIP (Std Quantity*Std Price) DM Price Variance RM (Actual Quantity*Actual Price) DM Quantity Variance 4,250,000 200,000 DL: 2,016,000 WIP (Std Hours *Std Rate) Factory Payroll (Actual Hours*Actual Rate) DL Rate Variance DL Efficiency Variance 1,937,500 62,500 16,000 VOH: 1,260,000 WIP (Std Hours* Std Variable Rate) Factory OH (Act Hours*Actual Var Rate) VOH Spending Variance VOH Efficiency Variance 1,200,000 50,000 10,000 FOH: 1,764,000 252,000 WIP (Std Hours*Std Fix Rate) FOH Volume Variance Factory OH (Act Hours* Actual Fix Rate) FOH Spending Variance 1,960,000 56,000 I also want to point out some exhibits the chapter to be familiar with. DM variance is shown in ex 8-10 (p.291), DL variance is shown in 8-11 (p.292), and expanded OH variances are shown in 8A.2 (p.303). VOH variances are shown in 8A.3 (p.303) and FOH variances are shown in 8A.4 (p.304). Need to Know Comprehensive Problem 8-6 (pp.300 - 302) and 8-7 (p.305) are excellent problems to try on your own before the homework and quiz as well