

Answered step by step
Verified Expert Solution
Question
1 Approved Answer
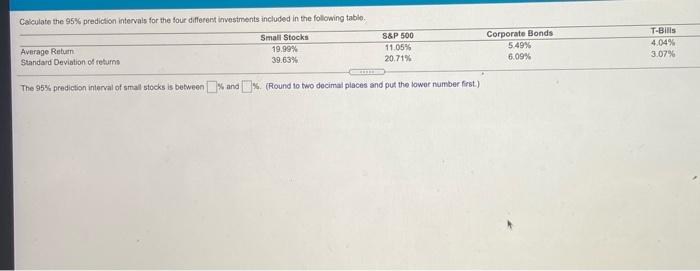
Calculate the 95% prediction intervals for the four different investments included in the following table Small Stocks 19.99% 39.63% S&P 500 11.05% 20.71% Corporate Bonds
Step by Step Solution
There are 3 Steps involved in it
Step: 1

Get Instant Access to Expert-Tailored Solutions
See step-by-step solutions with expert insights and AI powered tools for academic success
Step: 2

Step: 3
Ace Your Homework with AI
Get the answers you need in no time with our AI-driven, step-by-step assistance
Get Started
The AMA Handbook Of Financial Risk Management
Authors: John J. Hampton
1st Edition
0814417442, 978-0814417447