

Answered step by step
Verified Expert Solution
Question
1 Approved Answer
Calculate the company's WACC. Appendix 1. Sidral Mundet Sol-Income Statements for the Year Ending December 31 (thousands of pesos) Income Item 2009 2010 2011 Sales
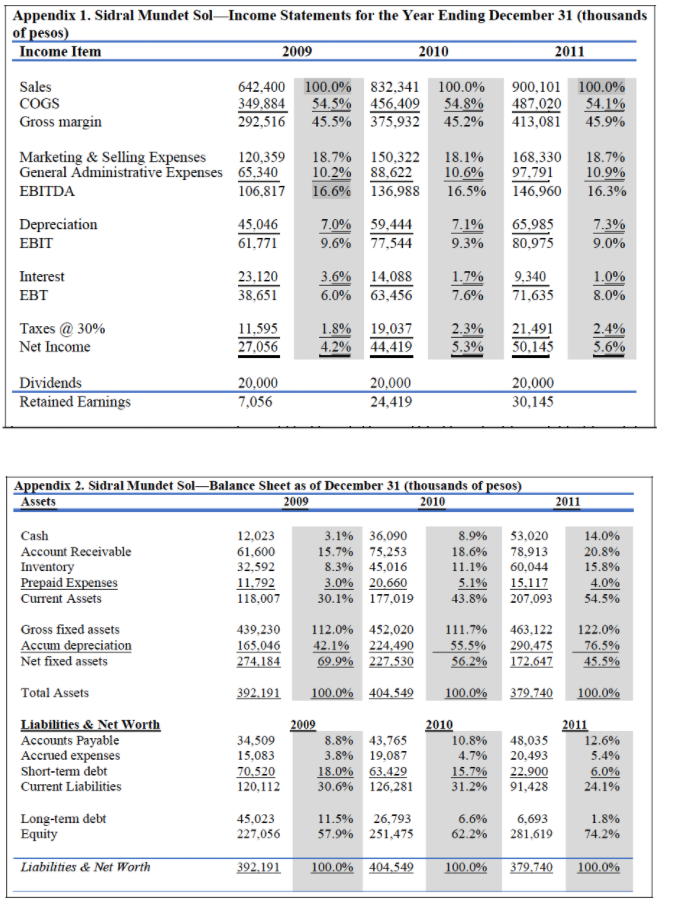
Calculate the company's WACC.
Appendix 1. Sidral Mundet Sol-Income Statements for the Year Ending December 31 (thousands of pesos) Income Item 2009 2010 2011 Sales 642,400 100.0% 832,341 100.0% 900,101 100.0% COGS 349,884 54.5% 456,409 54.8% 487,020 54.1% Gross margin 292,516 45.5% 375,932 45.2% 413,081 45.9% Marketing & Selling Expenses 120,359 General Administrative Expenses 65,340 EBITDA 106,817 18.7% 150,322 10.2% 88,622 16.6% 136,988 18.1% 10.6% 16.5% 168,330 97,791 146,960 18.7% 10.9% 16.3% Depreciation EBIT 45,046 61,771 7.0% 59,444 9.6% 77,544 7.1% 9.3% 65,985 80,975 7.3% 9.0% Interest EBT 23,120 38,651 3.6% 14,088 6.0% 63,456 1.7% 7.6% 9,340 71,635 1.0% 8.0% Taxes @ 30% Net Income 11,595 27,056 1.8% 19,037 4.2% 44,419 2.3% 5.3% 21,491 50,145 2.4% 5.6% Dividends Retained Earnings 20.000 7,056 20,000 24,419 20,000 30,145 Appendix 2. Sidral Mundet Sol-Balance Sheet as of December 31 (thousands of pesos) Assets 2009 2010 2011 Cash Account Receivable Inventory Prepaid Expenses Current Assets 12,023 61,600 32,592 11.792 118,007 3.1% 36,090 15.7% 75,253 8.3% 45,016 3.0% 20,660 30.1% 177,019 8.9% 18.6% 11.1% 5.1% 43.8% 53,020 78,913 60,044 15.117 207,093 14.0% 20.8% 15.8% 4.0% 54.5% 439,230 165.046 274.184 112.0% 452,020 42.1% 224,490 69.9% 227.530 111.7% 35.5% 56.2% 463,122 290,475 172.647 122.0% 76.5% 45.5% 392.191 100.0% 404,549 100.0% 379.740 100.0% Gross fixed assets Accum depreciation Net fixed assets Total Assets Liabilities & Net Worth Accounts Payable Accrued expenses Short-term debt Current Liabilities 34,509 15,083 70,520 120,112 2009 8.8% 43,765 3.8% 19,087 18.0% 63,429 30.6% 126,281 2010 10.8% 4.7% 15.7% 31.2% 48,035 20,493 22.900 91,428 2011 12.6% 5.4% 6.0% 24.1% Long-term debt Equity 45,023 227,056 11.5% 26,793 57.9% 251,475 6.6% 62.2% 6,693 281,619 1.8% 74.2% Liabilities & Net Worth 392.191 100.0% 404,549 100.0% 379,740 100.0% Appendix 1. Sidral Mundet Sol-Income Statements for the Year Ending December 31 (thousands of pesos) Income Item 2009 2010 2011 Sales 642,400 100.0% 832,341 100.0% 900,101 100.0% COGS 349,884 54.5% 456,409 54.8% 487,020 54.1% Gross margin 292,516 45.5% 375,932 45.2% 413,081 45.9% Marketing & Selling Expenses 120,359 General Administrative Expenses 65,340 EBITDA 106,817 18.7% 150,322 10.2% 88,622 16.6% 136,988 18.1% 10.6% 16.5% 168,330 97,791 146,960 18.7% 10.9% 16.3% Depreciation EBIT 45,046 61,771 7.0% 59,444 9.6% 77,544 7.1% 9.3% 65,985 80,975 7.3% 9.0% Interest EBT 23,120 38,651 3.6% 14,088 6.0% 63,456 1.7% 7.6% 9,340 71,635 1.0% 8.0% Taxes @ 30% Net Income 11,595 27,056 1.8% 19,037 4.2% 44,419 2.3% 5.3% 21,491 50,145 2.4% 5.6% Dividends Retained Earnings 20.000 7,056 20,000 24,419 20,000 30,145 Appendix 2. Sidral Mundet Sol-Balance Sheet as of December 31 (thousands of pesos) Assets 2009 2010 2011 Cash Account Receivable Inventory Prepaid Expenses Current Assets 12,023 61,600 32,592 11.792 118,007 3.1% 36,090 15.7% 75,253 8.3% 45,016 3.0% 20,660 30.1% 177,019 8.9% 18.6% 11.1% 5.1% 43.8% 53,020 78,913 60,044 15.117 207,093 14.0% 20.8% 15.8% 4.0% 54.5% 439,230 165.046 274.184 112.0% 452,020 42.1% 224,490 69.9% 227.530 111.7% 35.5% 56.2% 463,122 290,475 172.647 122.0% 76.5% 45.5% 392.191 100.0% 404,549 100.0% 379.740 100.0% Gross fixed assets Accum depreciation Net fixed assets Total Assets Liabilities & Net Worth Accounts Payable Accrued expenses Short-term debt Current Liabilities 34,509 15,083 70,520 120,112 2009 8.8% 43,765 3.8% 19,087 18.0% 63,429 30.6% 126,281 2010 10.8% 4.7% 15.7% 31.2% 48,035 20,493 22.900 91,428 2011 12.6% 5.4% 6.0% 24.1% Long-term debt Equity 45,023 227,056 11.5% 26,793 57.9% 251,475 6.6% 62.2% 6,693 281,619 1.8% 74.2% Liabilities & Net Worth 392.191 100.0% 404,549 100.0% 379,740 100.0%Step by Step Solution
There are 3 Steps involved in it
Step: 1

Get Instant Access to Expert-Tailored Solutions
See step-by-step solutions with expert insights and AI powered tools for academic success
Step: 2

Step: 3
Ace Your Homework with AI
Get the answers you need in no time with our AI-driven, step-by-step assistance
Get Started
Personal Finance Building Your Future
Authors: Robert Walker, Kristy Walker
2nd Edition
0077861728, 9780077861728