Answered step by step
Verified Expert Solution
Question
1 Approved Answer
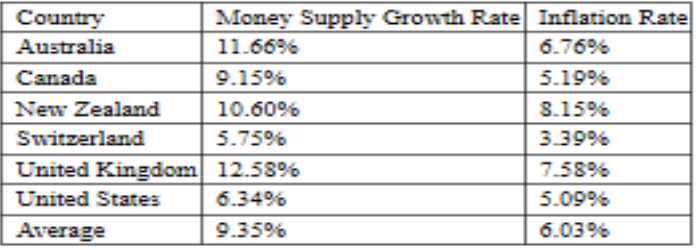
Calculate the covariance and correlation of Money Supply Growth Rate and Inflation Rate. Test the null hypothesis, H0, that the true correlation in the population

Calculate the covariance and correlation of Money Supply Growth Rate and Inflation Rate.
Test the null hypothesis, H0, that the true correlation in the population is 0 ( = 0) against the alternative hypothesis, Ha, that the correlation in the population is different from 0 ( 0) at the 10, 5 and 1 % levels of significance.
Solve the linear regression equation step by step for b1hat and b0hat.
Compute the Standard Error of Estimate.
Calculate the coefficient of determination for the regression using:

Step by Step Solution
There are 3 Steps involved in it
Step: 1

Get Instant Access to Expert-Tailored Solutions
See step-by-step solutions with expert insights and AI powered tools for academic success
Step: 2

Step: 3

Ace Your Homework with AI
Get the answers you need in no time with our AI-driven, step-by-step assistance
Get Started


