

Answered step by step
Verified Expert Solution
Question
1 Approved Answer
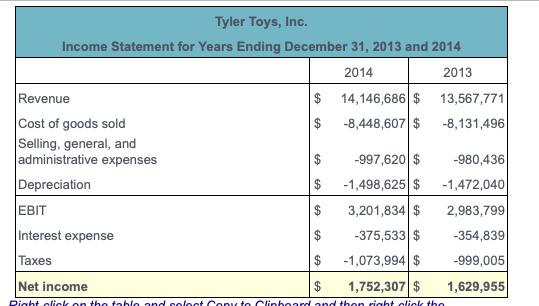
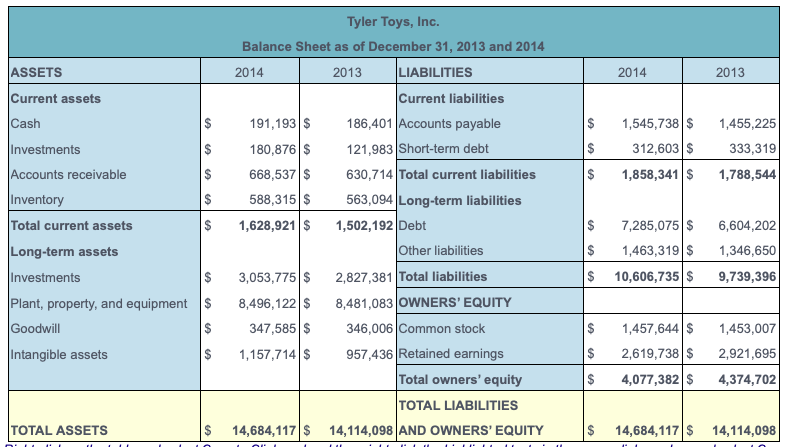
Calculate the debt ratio, times interest earned ratio, and cash coverage ratio for 2013 and 2014 for Tyler Toys. Should Financial ratios: Financial leverage. The

Step by Step Solution
There are 3 Steps involved in it
Step: 1

Get Instant Access to Expert-Tailored Solutions
See step-by-step solutions with expert insights and AI powered tools for academic success
Step: 2

Step: 3
Ace Your Homework with AI
Get the answers you need in no time with our AI-driven, step-by-step assistance
Get Started
The Geography Of Finance
Authors: Gordon L. Clark, Darius Wójcik
1st Edition
0199213364, 978-0199213368