Answered step by step
Verified Expert Solution
Link Copied!

Question

1 Approved Answer

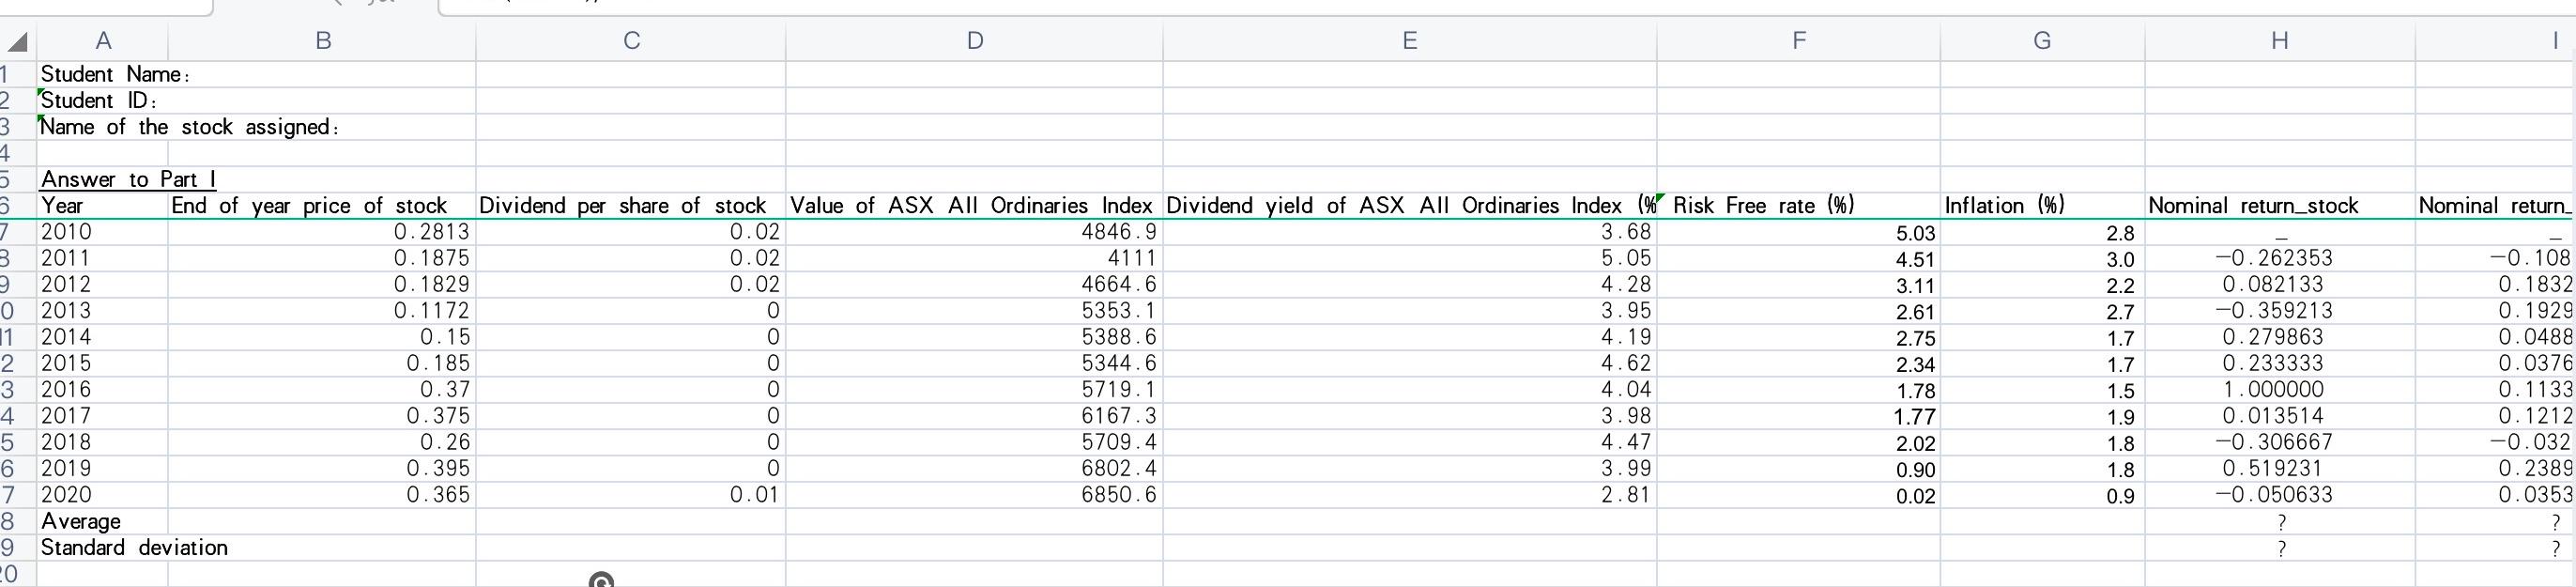
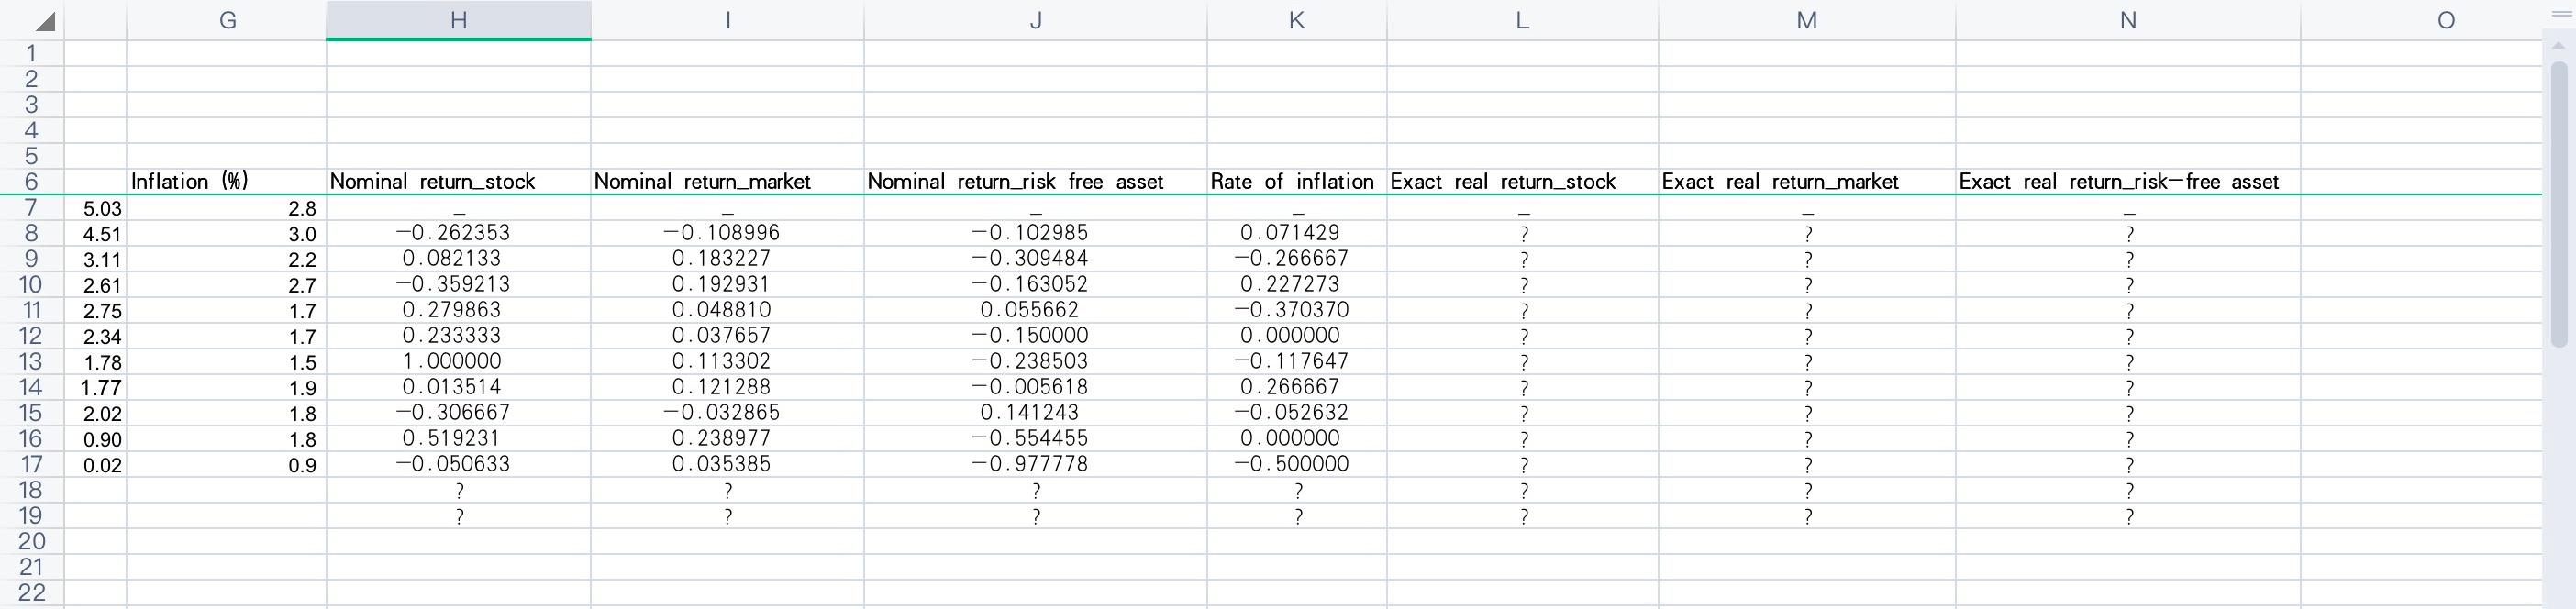
Calculate the exact annual real return (2010-2020) for the stock in column L (in decimals). Calculate the exact annual real return (2010-2020) for the market

  1. Calculate the exact annual real return (2010-2020) for the stock in column L (in decimals).
  2. Calculate the exact annual real return (2010-2020) for the market in column M (in decimals).
  3. Calculate the exact annual real return (2010-2020) for the risk-free asset in column N (in decimals).
  4. Using your calculations in (I) above, calculate the averages and standard deviations for the variables in Columns H-N and present them in the answer box provided. You can use the Excel functions to compute these statistics. When you present averages and standard deviations in the answer box, present them as percentages approximated to two decimalsimage text in transcribedimage text in transcribed
D E F G H A B Student Name: Student ID: Name of the stock assigned: 1. 2 3 4 5 3 7 3 Inflation (%) Nominal return_stock Nominal return_ 0 11 2 3 4 5 6 7 8 9 0 Answer to Part 1 Year End of year price of stock Dividend per share of stock Value of ASX All Ordinaries Index Dividend yield of ASX All Ordinaries Index (% Risk Free rate (%) 2010 0.2813 0.02 4846.9 3.68 2011 0.1875 0.02 4111 5.05 2012 0.1829 0.02 4664.6 4.28 2013 0.1172 0 5353.1 3.95 2014 0.15 0 5388.6 4.19 2015 0.185 0 5344.6 4.62 2016 0.37 0 5719.1 4.04 2017 0.375 6167.3 3.98 2018 0.26 5709.4 4.47 2019 0.395 6802.4 3.99 2020 0.365 0.01 6850.6 2.81 Average Standard deviation 5.03 4.51 3.11 2.61 2.75 2.34 1.78 1.77 2.02 0.90 0.02 2.8 3.0 2.2 2.7 1.7 1.7 1.5 1.9 1.8 1.8 0.9 -0.262353 0.082133 -0.359213 0.279863 0.233333 1.000000 0.013514 -0.306667 0.519231 -0.050633 -0.108 0.1832 0.1929 0.0488 0.0376 0.1133 0.1212 -0.032 0.2389 0.0353 ? ? OOO ? C H | J K. L M N Inflation (%) Nominal return_stock Nominal return_market Nominal return_risk free asset Rate of inflation Exact real return_stock Exact real return_market Exact real return_risk-free asset 1 2 3 4 5 6 7 8 9 10 11 12 13 14 15 16 17 18 19 20 21 22 5.03 4.51 3.11 2.61 2.75 2.34 1.78 1.77 2.02 0.90 0.02 2.8 3.0 2.2 2.7 1.7 1.7 1.5 1.9 1.8 1.8 0.9 -0.262353 0.082133 -0.359213 0.279863 0.233333 1.000000 0.013514 -0.306667 0.519231 -0.050633 ? ? -0.108996 0.183227 0.192931 0.048810 0.037657 0.113302 0.121288 -0.032865 0.238977 0.035385 ? ? -0.102985 -0.309484 -0.163052 0.055662 -0.150000 -0.238503 -0.005618 0.141243 -0.554455 -0.977778 2 ? 0.071429 -0.266667 0.227273 -0.370370 0.000000 -0.117647 0.266667 -0.052632 0.000000 -0.500000 ? ? ? ? ? ? ? ? ? ? ? ? ? ? ? ? ? ? ? ? ? ? ? ? ? ? ? ? ? ? ? ? ? ? ? ? ? ? D E F G H A B Student Name: Student ID: Name of the stock assigned: 1. 2 3 4 5 3 7 3 Inflation (%) Nominal return_stock Nominal return_ 0 11 2 3 4 5 6 7 8 9 0 Answer to Part 1 Year End of year price of stock Dividend per share of stock Value of ASX All Ordinaries Index Dividend yield of ASX All Ordinaries Index (% Risk Free rate (%) 2010 0.2813 0.02 4846.9 3.68 2011 0.1875 0.02 4111 5.05 2012 0.1829 0.02 4664.6 4.28 2013 0.1172 0 5353.1 3.95 2014 0.15 0 5388.6 4.19 2015 0.185 0 5344.6 4.62 2016 0.37 0 5719.1 4.04 2017 0.375 6167.3 3.98 2018 0.26 5709.4 4.47 2019 0.395 6802.4 3.99 2020 0.365 0.01 6850.6 2.81 Average Standard deviation 5.03 4.51 3.11 2.61 2.75 2.34 1.78 1.77 2.02 0.90 0.02 2.8 3.0 2.2 2.7 1.7 1.7 1.5 1.9 1.8 1.8 0.9 -0.262353 0.082133 -0.359213 0.279863 0.233333 1.000000 0.013514 -0.306667 0.519231 -0.050633 -0.108 0.1832 0.1929 0.0488 0.0376 0.1133 0.1212 -0.032 0.2389 0.0353 ? ? OOO ? C H | J K. L M N Inflation (%) Nominal return_stock Nominal return_market Nominal return_risk free asset Rate of inflation Exact real return_stock Exact real return_market Exact real return_risk-free asset 1 2 3 4 5 6 7 8 9 10 11 12 13 14 15 16 17 18 19 20 21 22 5.03 4.51 3.11 2.61 2.75 2.34 1.78 1.77 2.02 0.90 0.02 2.8 3.0 2.2 2.7 1.7 1.7 1.5 1.9 1.8 1.8 0.9 -0.262353 0.082133 -0.359213 0.279863 0.233333 1.000000 0.013514 -0.306667 0.519231 -0.050633 ? ? -0.108996 0.183227 0.192931 0.048810 0.037657 0.113302 0.121288 -0.032865 0.238977 0.035385 ? ? -0.102985 -0.309484 -0.163052 0.055662 -0.150000 -0.238503 -0.005618 0.141243 -0.554455 -0.977778 2 ? 0.071429 -0.266667 0.227273 -0.370370 0.000000 -0.117647 0.266667 -0.052632 0.000000 -0.500000

Step by Step Solution

There are 3 Steps involved in it

Step: 1

blur-text-image

Get Instant Access to Expert-Tailored Solutions

See step-by-step solutions with expert insights and AI powered tools for academic success

Step: 2

blur-text-image

Step: 3

blur-text-image

Ace Your Homework with AI

Get the answers you need in no time with our AI-driven, step-by-step assistance

Get Started

Recommended Textbook for

Moolah Or Bummer A Humorous Look At Finance And Investing

Authors: Sharon Schwab

1st Edition

0595344313, 9780595344314

More Books

Students also viewed these Finance questions