

Question
Calculate the expected rate of return for each of the financial assets listed in Table 1, and complete the expected return row for Table 1.
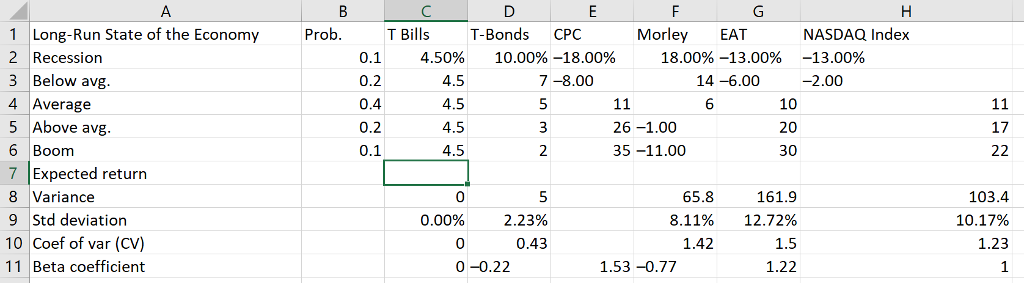
Calculate the expected rate of return for each of the financial assets listed in Table 1, and complete the expected return row for Table 1. Based solely on the expected returns, which of the investments appears the best and worst? Discuss the impact on returns for general changes in the economy for CPC, Morely, and EAT.
1 Long-Run State of the Economy 2 Recession 3 Below avg 4 Average 5 Above avg 6 Boom 7 Expected return 8 Variance 9 Std deviation 10 Coef of var (CV) 11 Beta coefficient T Bills T-Bonds CPC Morley EAT NASDAQ Index -13.00% -2.00 Prob 0.1 0.2 0.4 0.2 0.1 4.50% 4.5 4.5 4.5 4.5 10.00%-18.00% 18.00%-13.00% 7-8.00 14 -6.00 10 20 30 17 26-1.00 35-11.00 5 2.23% 0.43 65.8 8.11% 1.42 161.9 12.72% 1.5 1.22 103.4 10.17% 1.23 0.00% 0 0-0.22 1.53-0.77
Step by Step Solution
There are 3 Steps involved in it
Step: 1

Get Instant Access to Expert-Tailored Solutions
See step-by-step solutions with expert insights and AI powered tools for academic success
Step: 2

Step: 3
Ace Your Homework with AI
Get the answers you need in no time with our AI-driven, step-by-step assistance
Get Started
Ebay Easy Made How To Quickly And Easily Make Thousands Of Dollars Selling Everyday Items Online
Authors: Jay Johns
1st Edition
1544010729, 978-1544010724