

Answered step by step
Verified Expert Solution
Question
1 Approved Answer
Calculate the expected value and that standard deviation of variables X, and Y, given the probability distribution presented in Table 1 (see next page). Which
Calculate the expected value and that standard deviation of variables X, and Y, given the probability distribution presented in Table 1 (see next page).
Which loss outcome looks less risky? Please explain.
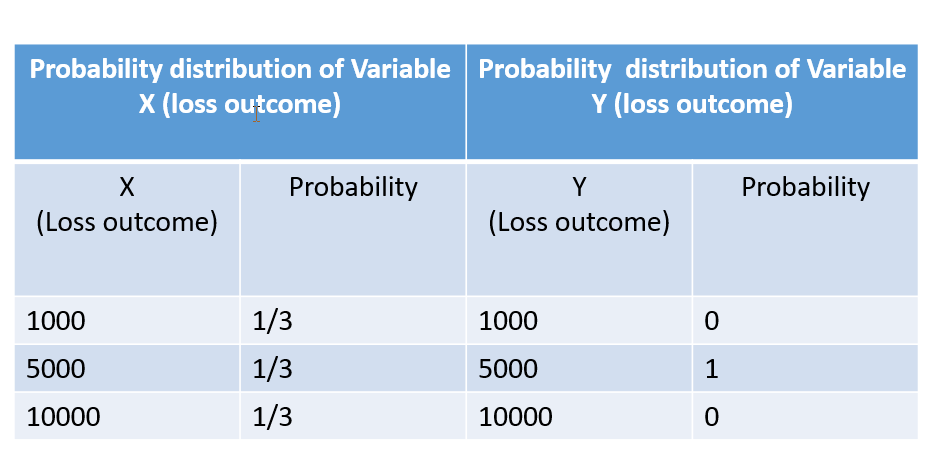 \begin{tabular}{|c|l|l|l|} \hline \multicolumn{2}{|c|}{ProbabilitydistributionofVariableX(lossoutcome)} & ProbabilitydistributionofVariableY(lossoutcome) \\ \hline X(Lossoutcome) & Probability & Y(Lossoutcome) & Probability \\ \hline 1000 & 1/3 & 1000 & 0 \\ \hline 5000 & 1/3 & 5000 & 1 \\ \hline 10000 & 1/3 & 10000 & 0 \\ \hline \end{tabular}
 Step by Step Solution
There are 3 Steps involved in it
Step: 1

Get Instant Access to Expert-Tailored Solutions
See step-by-step solutions with expert insights and AI powered tools for academic success
Step: 2

Step: 3
Ace Your Homework with AI
Get the answers you need in no time with our AI-driven, step-by-step assistance
Get Started
QFinance The Ultimate Resource
Authors: Various Authors
1st Edition
1849300003, 978-1849300001