Calculate the fellowing ratios
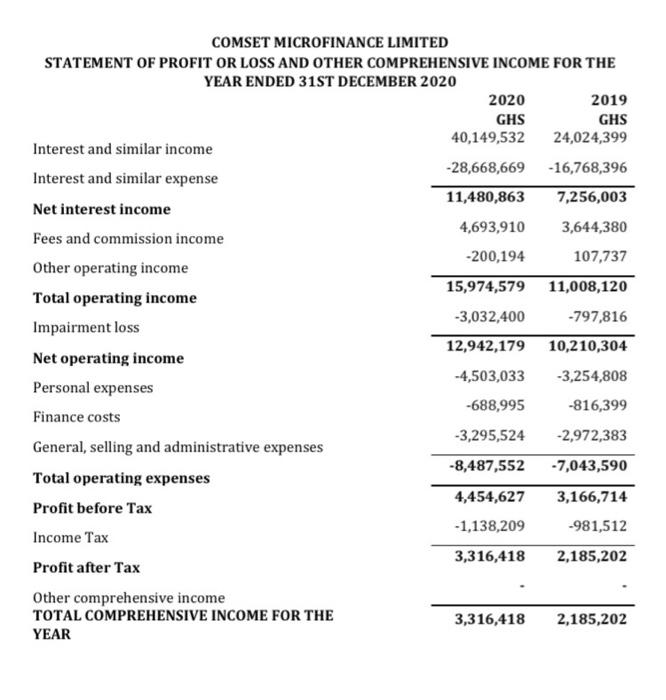
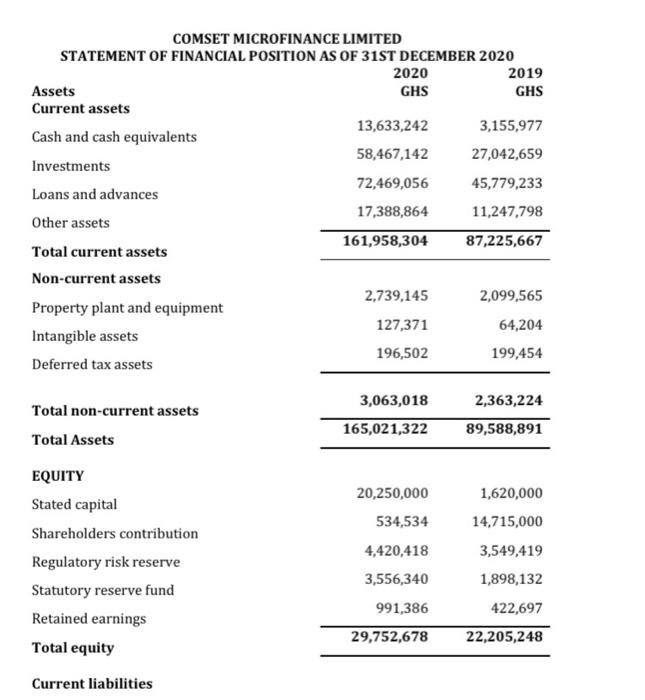
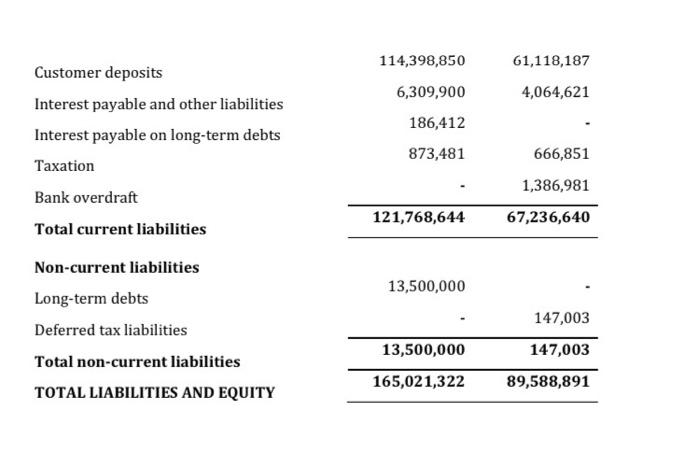
COMSET MICROFINANCE LIMITED STATEMENT OF PROFIT OR LOSS AND OTHER COMPREHENSIVE INCOME FOR THE YEAR ENDED 31ST DECEMBER 2020 2020 2019 GHS GHS 40,149,532 24,024,399 Interest and similar income Interest and similar expense -28,668,669 -16,768,396 11,480,863 7,256,003 Net interest income 4,693,910 3,644,380 Fees and commission income -200,194 107,737 Other operating income 15,974,579 11,008,120 Total operating income -3,032,400 -797,816 Impairment loss 12,942,179 10,210,304 Net operating income -4,503,033 -3,254,808 Personal expenses -688,995 -816,399 Finance costs -3,295,524 -2,972,383 General, selling and administrative expenses -8,487,552 -7,043,590 Total operating expenses 4,454,627 3,166,714 Profit before Tax -1,138,209 -981,512 Income Tax 3,316,418 2,185,202 Profit after Tax Other comprehensive income TOTAL COMPREHENSIVE INCOME FOR THE 3,316,418 2,185,202 YEAR COMSET MICROFINANCE LIMITED STATEMENT OF FINANCIAL POSITION AS OF 31ST DECEMBER 2020 2020 2019 Assets GHS GHS Current assets 13,633,242 3,155,977 Cash and cash equivalents 58,467,142 27,042,659 Investments 72,469,056 45,779,233 Loans and advances 17,388,864 11,247,798 Other assets 161,958,304 87,225,667 Total current assets Non-current assets 2,739,145 2,099,565 Property plant and equipment 127,371 64,204 Intangible assets 196,502 199,454 Deferred tax assets 3,063,018 Total non-current assets Total Assets 2,363,224 89,588,891 165,021,322 20,250,000 534,534 EQUITY Stated capital Shareholders contribution Regulatory risk reserve Statutory reserve fund Retained earnings Total equity 4,420,418 3,556,340 1,620,000 14,715,000 3,549,419 1,898,132 422,697 22,205,248 991,386 29,752,678 Current liabilities 114,398,850 61,118,187 4,064,621 Customer deposits Interest payable and other liabilities Interest payable on long-term debts Taxation Bank overdraft Total current liabilities 6,309,900 186,412 873,481 666,851 1,386,981 121,768,644 67,236,640 13,500,000 Non-current liabilities Long-term debts Deferred tax liabilities Total non-current liabilities TOTAL LIABILITIES AND EQUITY 147,003 147,003 13,500,000 165,021,322 89,588,891 V. Portfolio to assets vi. Loan loss provision (impairment loss expense) ratio vii. Debt to equity (leverage) viii. Equity to assets ratio ix. Loans to deposits ratio x. Liquid assets to total assets xi. Operational self-sufficiency xii. Financial expense ratio


 Calculate the fellowing ratios


