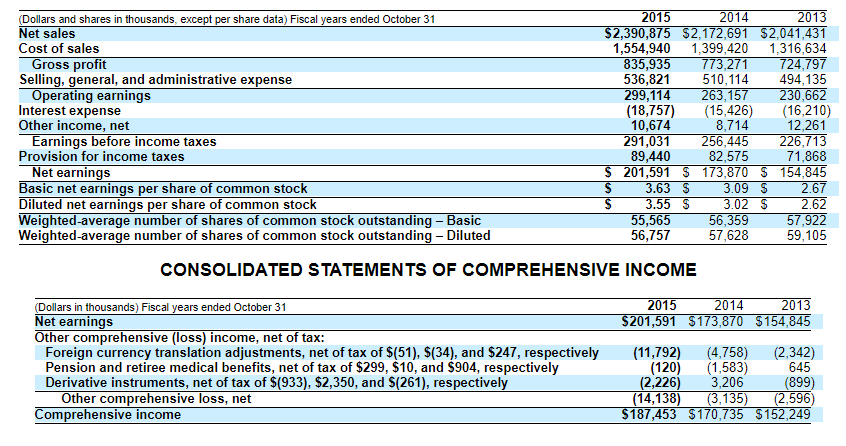
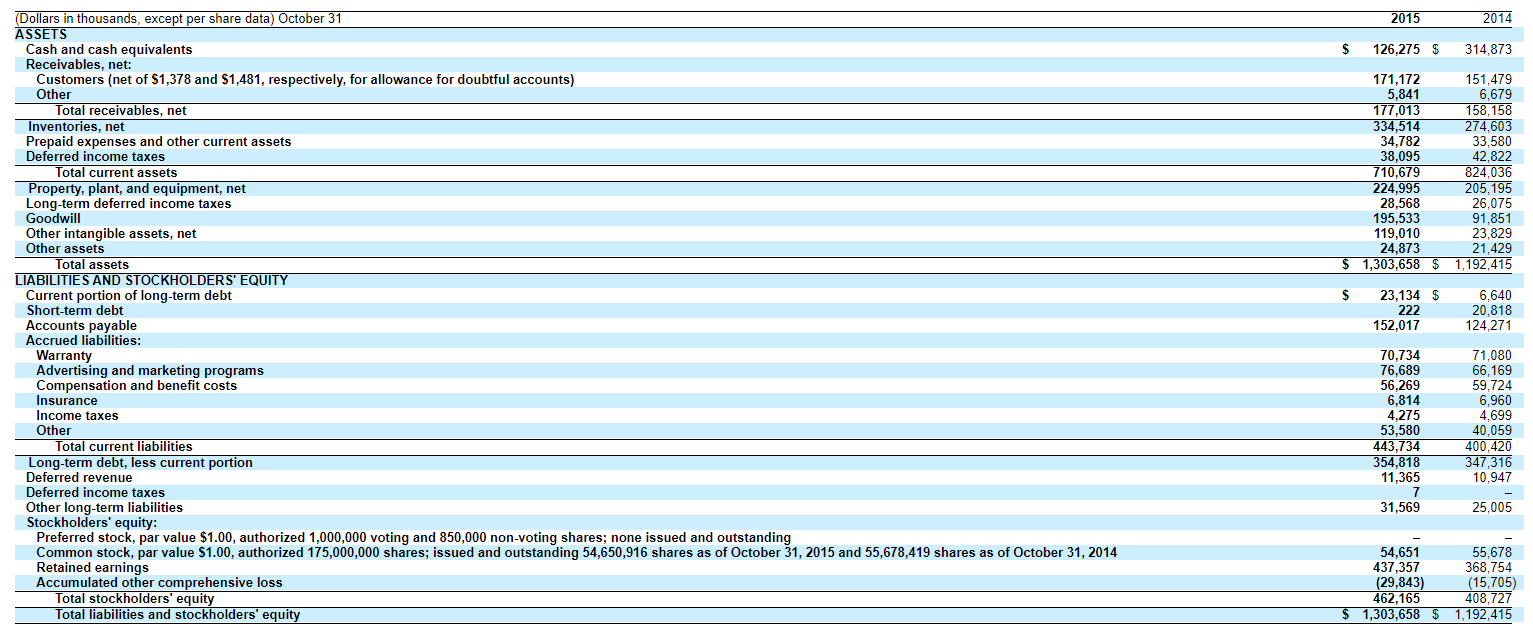
Calculate the fixed asset turnover ratio for 2015 using the information from the companies balance sheet below.


(Dollars and shares in thousands, except per share data) Fiscal years ended October 31 Net sales Cost of sales Gross profit Selling, general, and administrative expense Operating earnings Interest expense Other income, net Earnings before income taxes Provision for income taxes Net earnings Basic net earnings per share of common stock Diluted net earnings per share of common stock Weighted average number of shares of common stock outstanding - Basic Weighted average number of shares of common stock ou number of shares of common stock outstanding - Diluted 2015 2014 2013 $2,390,875 $2,172,691 $2,041,431 1,554,940 1,399,420 1,316,634 835,935 773,271 724,797 536,821 510,114 494,135 299,114 263,157 230,662 (18,757) (15,426) (16,210) 10,674 8,714 12,261 291,031 256,445 226,713 89,440 82,575 71,868 $ 201,591 $ 173,870 $ 154,845 $ 3.63 $ 3.09 $ 2.67 $ 3.55 $ 3.02 $ 2.62 55,565 56,359 57,922 56,757 57,628 59,105 CONSOLIDATED STATEMENTS OF COMPREHENSIVE INCOME 2015 2014 2013 $201,591 $173,870 $154,845 (Dollars in thousands) Fiscal years ended October 31 Net earnings Other comprehensive (loss) income, net of tax: Foreign currency translation adjustments, net of tax of $(51), $(34), and $247, respectively Pension and retiree medical benefits, net of tax of $299, $10, and $904, respectively Derivative instruments, net of tax of $(933), $2,350, and $(261), respectively Other comprehensive loss, net Comprehensive income (11,792) (4,758) (120) (1,583) (2,226) 3,206 (14,138) (3,135) $187,453 $170,735 (2,342) 645 (899) (2,596) $152,249 2015 2014 $ 126,275 $ 314,873 171,172 5.841 177,013 334,514 34,782 38,095 710,679 224,995 28,568 195,533 119,010 24.873 1,303,658 $ 151,479 6,679 158,158 274,603 33,580 42.822 824,036 205,195 26,075 91,851 23,829 21,429 1,192,415 $ $ (Dollars in thousands, except per share data) October 31 ASSETS Cash and cash equivalents Receivables, net: Customers (net of $1,378 and $1,481, respectively, for allowance for doubtful accounts) Other Total receivables, net Inventories, net Prepaid expenses and other current assets Deferred income taxes Total current assets Property, plant, and equipment, net Long-term deferred income taxes Goodwill Other intangible assets, net Other assets Total assets LIABILITIES AND STOCKHOLDERS' EQUITY Current portion of long-term debt Short-term debt Accounts payable Accrued liabilities: Warranty Advertising and marketing programs Compensation and benefit costs Insurance Income taxes Other Total current liabilities Long-term debt, less current portion Deferred revenue Deferred income taxes Other long-term liabilities Stockholders' equity: Preferred stock, par value $1.00, authorized 1,000,000 voting and 850,000 non-voting shares; none issued and outstanding Common stock, par value $1.00, authorized 175,000,000 shares; issued and outstanding 54,650,916 shares as of October 31, 2015 and 55,678,419 shares as of October 31, 2014 Retained earnings Accumulated other comprehensive loss Total stockholders' equity Total liabilities and stockholders' equity 23,134 $ 222 152,017 6,640 20,818 124,271 70,734 76,689 56,269 6,814 4,275 53,580 443,734 354,818 11,365 71,080 66,169 59,724 6.960 4,699 40,059 400,420 347,316 10,947 31,569 25,005 54,651 437,357 (29,843) 462,165 1,303,658 55,678 368,754 (15,705) 408,727 1.192.415 $ $


