

Answered step by step
Verified Expert Solution
Question
1 Approved Answer
Calculate the following debt and asset management ratios for 2020: a) total asset turnover, b) debt to equity ratio. Goldenview Health System Operating Data (Volume)
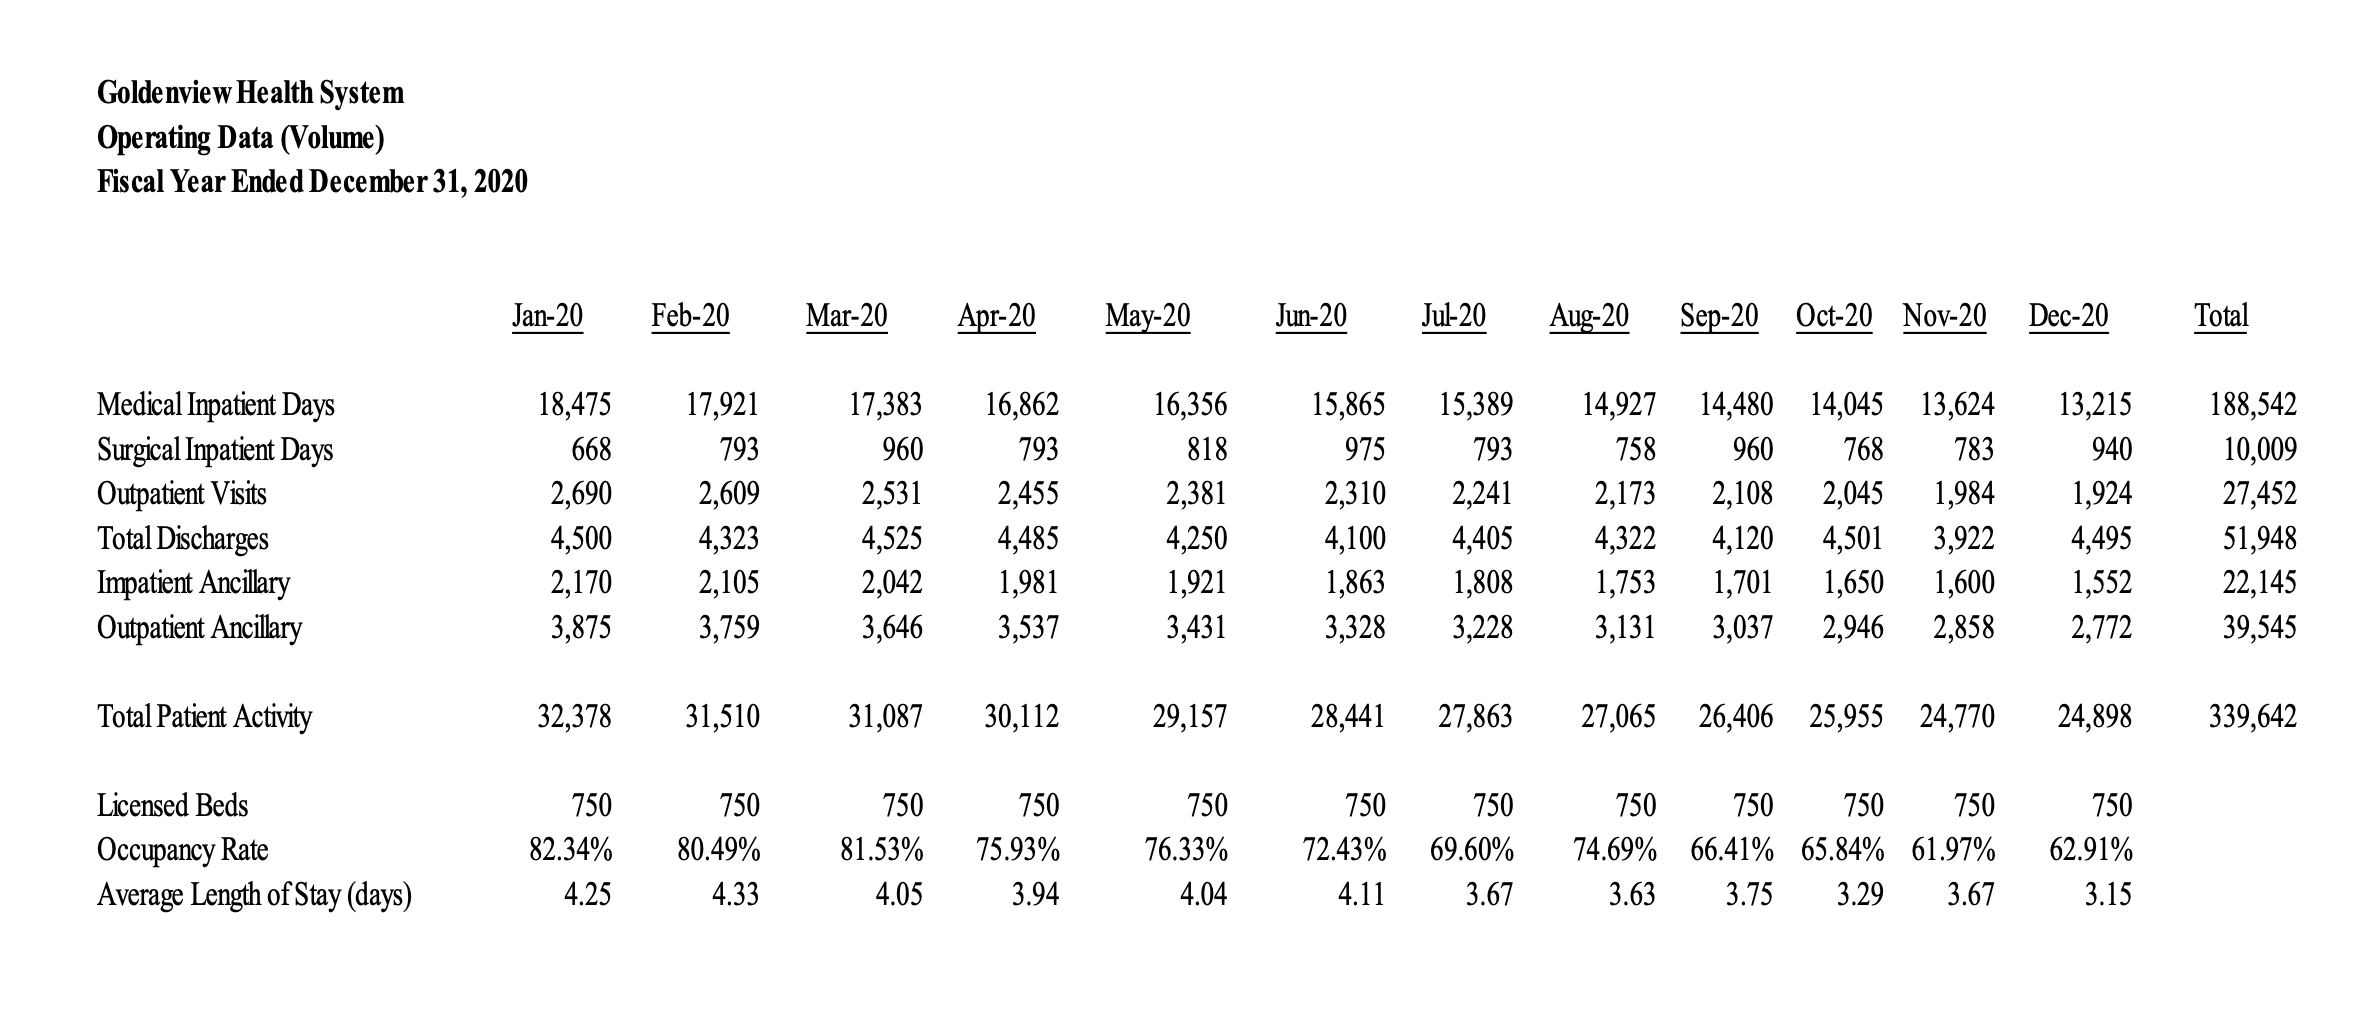 Calculate the following debt and asset management ratios for 2020: a) total asset turnover, b) debt to equity ratio.
Step by Step Solution
There are 3 Steps involved in it
Step: 1

Get Instant Access to Expert-Tailored Solutions
See step-by-step solutions with expert insights and AI powered tools for academic success
Step: 2

Step: 3
Ace Your Homework with AI
Get the answers you need in no time with our AI-driven, step-by-step assistance
Get Started
Get Rich With Dividends
Authors: Marc Lichtenfeld
3rd Edition
1119985552, 978-1119985556