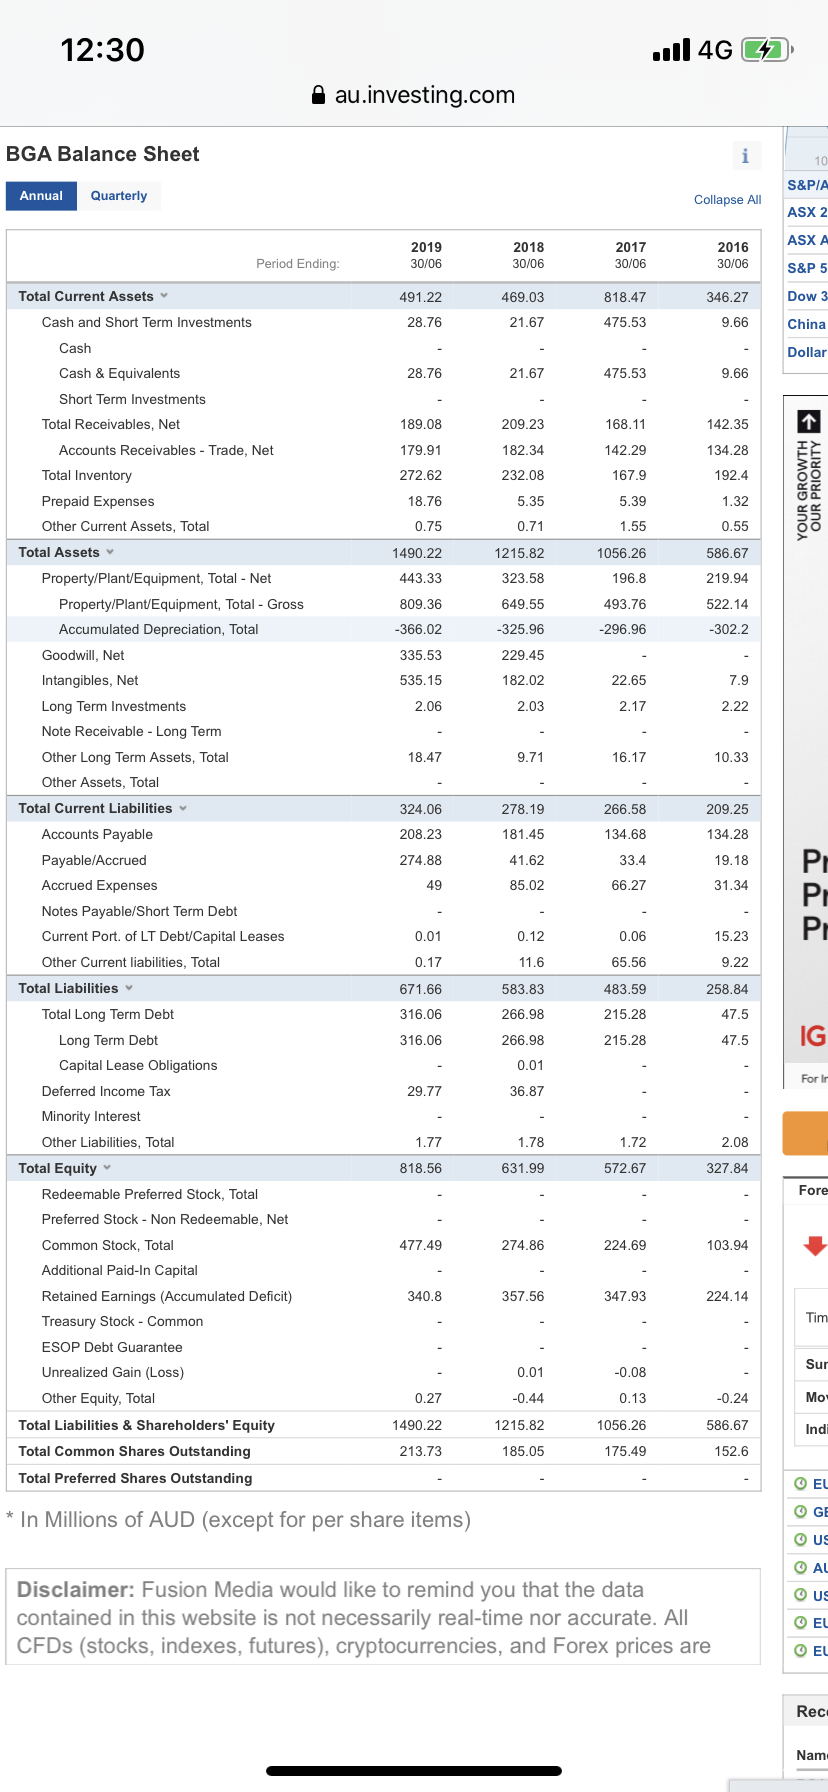
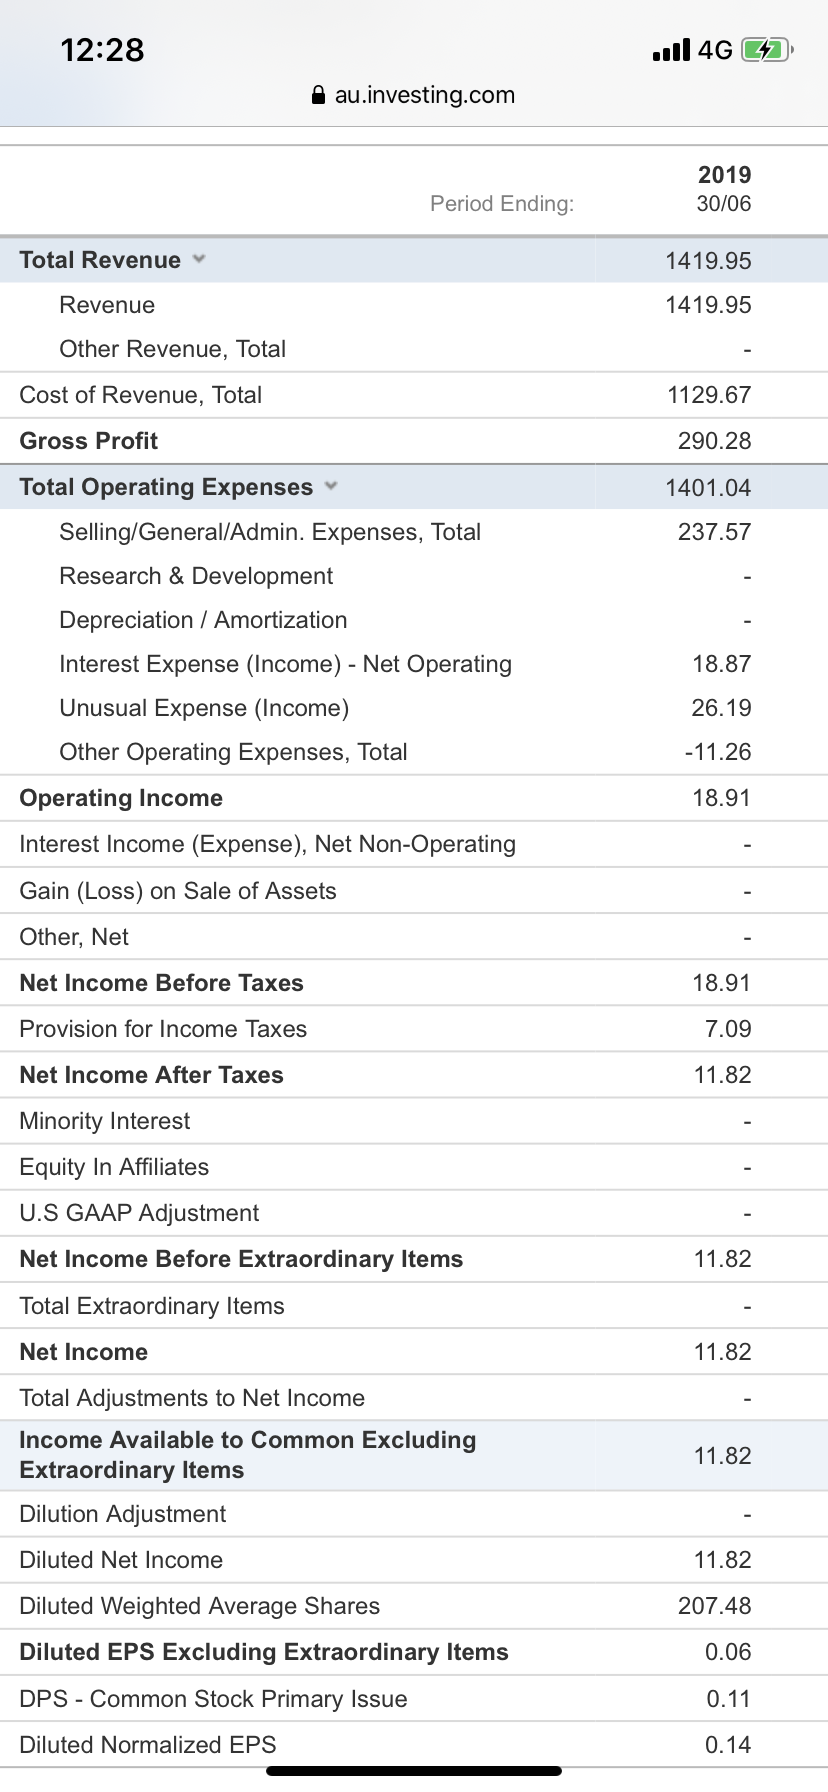
Calculate the following financial ratio from the given balance sheet and income statement for FY 2019 :
1) Net Profit %
2) Inventory turnover (days)
3) Age of account receivable
4) Return on equity %
5) Current Ratio
6) Liquid Ratio
7) Return on assets %
8) Equity Ratio
NOTE: IN MILLIONS OF AUD
12:30 4G G2 au.investing.com BGA Balance Sheet 10 S&PIA Annual Quarterly Collapse All ASX 2 Period Ending: 2019 30/06 2018 30/06 2017 30/06 2016 30/06 818.47 491.22 28.76 469.03 21.67 346.27 9.66 ASX A S&P 5 Dow 3 China Dollar 475.53 28.76 21.67 475.53 9.66 142.35 209.23 182.34 232.08 189.08 179.91 272.62 18.76 0.75 1490.22 168.11 142.29 167.9 5.39 1.55 134.28 192.4 YOUR GROWTH OUR PRIORITY 5.35 1.32 0.71 0.55 1056.26 196.8 443.33 586.67 219.94 522.14 -302.2 Total Current Assets Cash and Short Term Investments Cash Cash & Equivalents Short Term Investments Total Receivables, Net Accounts Receivables - Trade, Net Total Inventory Prepaid Expenses Other Current Assets, Total Total Assets Property/Plant/Equipment, Total - Net Property/Plant/Equipment, Total - Gross Accumulated Depreciation, Total Goodwill, Net Intangibles, Net Long Term Investments Note Receivable - Long Term Other Long Term Assets, Total Other Assets, Total Total Current Liabilities Accounts Payable Payable/Accrued Accrued Expenses Notes Payable/Short Term Debt Current Port of LT Debt/Capital Leases Other Current liabilities, Total Total Liabilities Total Long Term Debt Long Term Debt Capital Lease Obligations 1215.82 323.58 649.55 -325.96 229.45 182.02 2.03 493.76 -296.96 809.36 -366.02 335.53 535.15 2.06 22.65 2.17 2.22 18.47 9.71 16.17 10.33 324.06 208.23 274.88 209.25 134.28 278.19 181.45 41.62 85.02 266.58 134.68 33.4 66.27 19.18 31.34 a 0.12 0.06 15.23 9.22 11.6 0.01 0.17 671.66 316.06 316.06 258.84 65.56 483.59 215.28 215.28 583.83 266.98 266.98 0.01 36.87 475 47.5 o Deferred Income Tax 29.77 Minority Interest Other Liabilities, Total Total Equity 1.77 818.56 1.78 631.99 1.72 572.67 2.08 327.84 Fore 477.49 274.86 224.69 103.94 340.8 357.56 347.93 224.14 Tim Redeemable Preferred Stock, Total Preferred Stock - Non Redeemable, Net Common Stock, Total Additional Paid-In Capital Retained Earnings (Accumulated Deficit) Treasury Stock - Common ESOP Debt Guarantee Unrealized Gain (Loss) Other Equity, Total Total Liabilities & Shareholders' Equity Total Common Shares Outstanding Total Preferred Shares Outstanding Sur -0.08 0.01 -0.44 0.27 0.13 1215.82 1490.22 213.73 Indi -0.24 586.67 152.6 1056.26 175.49 185.05 EL * In Millions of AUD (except for per share items) GE Ous AL Disclaimer: Fusion Media would like to remind you that the data contained in this website is not necessarily real-time nor accurate. All CFDs (stocks, indexes, futures), cryptocurrencies, and Forex prices are us EL EL Reco Nam: 12:28 ull 4G G2 au.investing.com 2019 30/06 Period Ending: Total Revenue 1419.95 Revenue 1419.95 1129.67 290.28 Other Revenue, Total Cost of Revenue, Total Gross Profit Total Operating Expenses Selling/General/Admin. Expenses, Total Research & Development 1401.04 237.57 Depreciation / Amortization Interest Expense (Income) - Net Operating Unusual Expense (Income) Other Operating Expenses, Total Operating Income Interest Income (Expense), Net Non-Operating Gain (Loss) on Sale of Assets Other, Net 18.87 26.19 -11.26 18.91 Net Income Before Taxes 18.91 Provision for Income Taxes 7.09 Net Income After Taxes 11.82 Minority Interest Equity In Affiliates U.S GAAP Adjustment Net Income Before Extraordinary Items 11.82 Total Extraordinary Items Net Income 11.82 Total Adjustments to Net Income Income Available to Common Excluding Extraordinary Items 11.82 Dilution Adjustment Diluted Net Income 11.82 207.48 0.06 Diluted Weighted Average Shares Diluted EPS Excluding Extraordinary Items DPS - Common Stock Primary Issue Diluted Normalized EPS 0.11 0.14