Calculate the following financial ratios for fiscal year 2018 only using the "Consolidated Statements of Earn" and "Consolidated Balance Sheets" worksheets in Starbucks 2017 and 2018 Annual Financial Statements : Current Ratio, Cash Ratio, Inventory Turnover, Days Sales in Inventory, Long Term Debt Ratio, Times Interest Earned, Gross Profit Margin, Net Profit Margin, Return on Equity, Return on Assets.
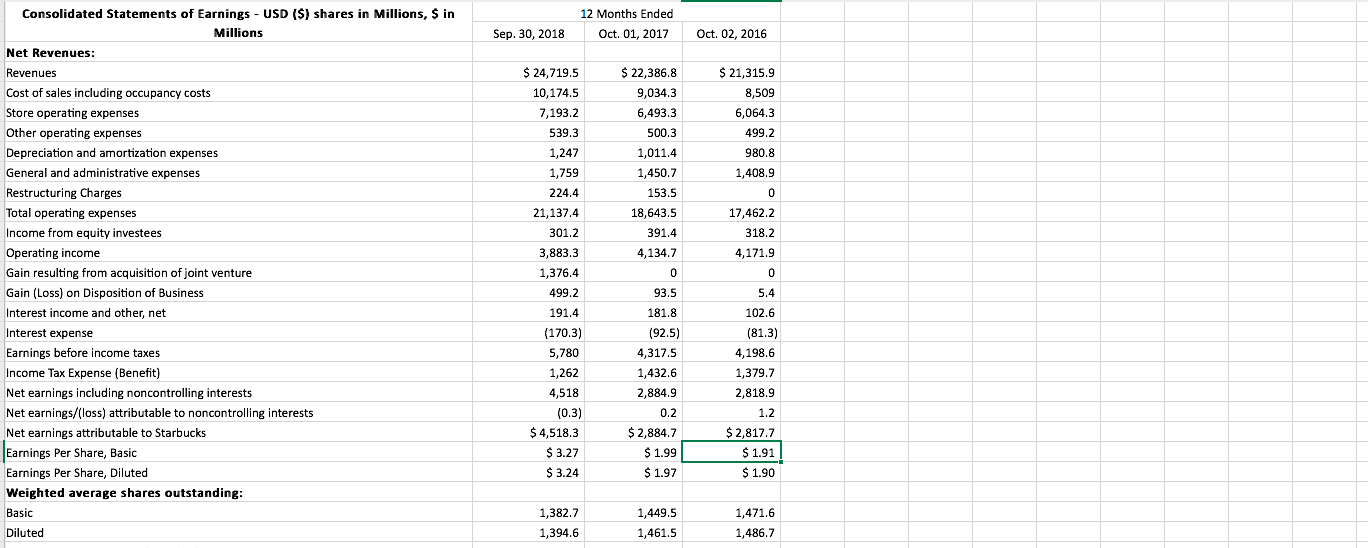
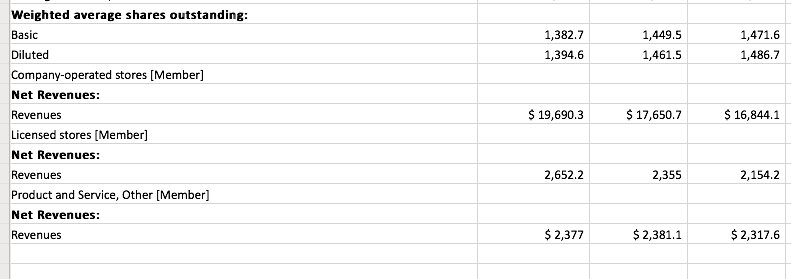
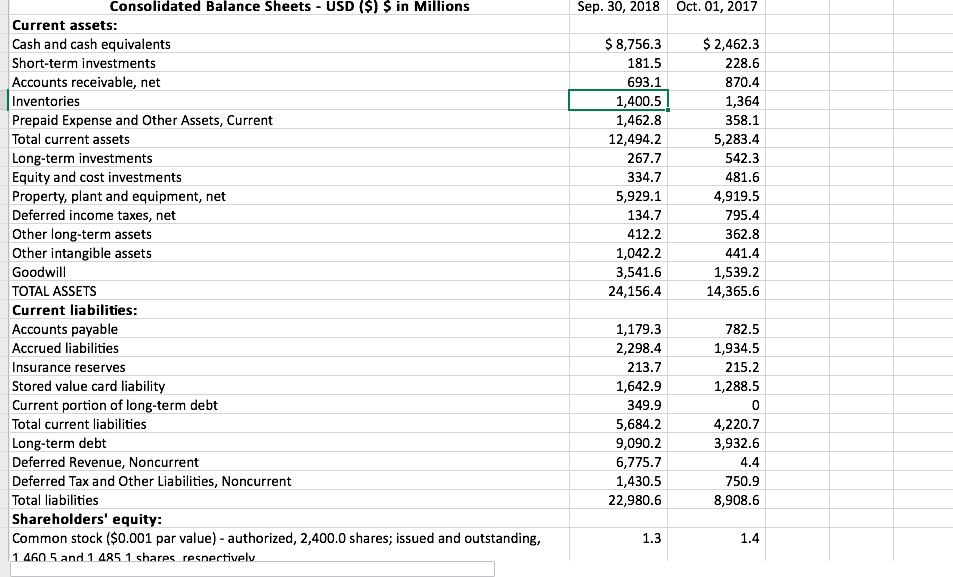
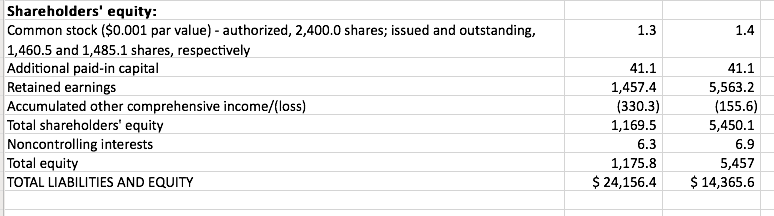
12 Months Ended Oct. 01, 2017 Sep. 30, 2018 Oct. 02, 2016 $ 22,386.8 9,034,3 6,493.3 500.3 1,011.4 1,450.7 153.5 18,643.5 $ 21,315.9 8,509 6,064.3 499.2 980.8 1,408.9 0 17,462.2 391.4 318.2 Consolidated Statements of Earnings - USD ($) shares in Millions, $ in Millions Net Revenues: Revenues Cost of sales including occupancy costs Store operating expenses Other operating expenses Depreciation and amortization expenses General and administrative expenses Restructuring Charges Total operating expenses Income from equity investees Operating income Gain resulting from acquisition of joint venture Gain (Loss) on Disposition of Business Interest income and other, net Interest expense Earnings before income taxes Income Tax Expense (Benefit) Net earnings including noncontrolling interests Net earnings/(loss) attributable to noncontrolling interests Net earnings attributable to Starbucks Earnings Per Share, Basic Earnings Per Share, Diluted Weighted average shares outstanding: Basic Diluted $ 24,719.5 10,174.5 7,193.2 539.3 1,247 1,759 224.4 21,137.4 301.2 3,883.3 1,376.4 499.2 191.4 (170.3) 5,780 1,262 4,518 (0.3) $4,518.3 $ 3.27 $ 3.24 4,134.7 0 4,171.9 0 5.4 93.5 181.8 (92.5) 4,317.5 1,432.6 2,884.9 0.2 $ 2,884.7 $ 1.99 $ 1.97 102.6 (81.3) 4,198.6 1,379.7 2,818.9 1.2 $ 2,817.7 $ 1.91 $ 1.90 1,382.7 1,449.5 1,461.5 1,471.6 1,486.7 1,394.6 1,382.7 1,394.6 1,449.5 1,461.5 1,471.6 1,486.7 Weighted average shares outstanding: Basic Diluted Company-operated stores [Member] Net Revenues: Revenues Licensed stores (Member) Net Revenues: Revenues Product and Service, Other (Member) Net Revenues: $ 19,690.3 $ 17,650.7 $ 16,844.1 2,652.2 2,355 2,154.2 Revenues $ 2,377 $ 2,381.1 $ 2,317.6 Sep. 30, 2018 Oct. 01, 2017 Consolidated Balance Sheets - USD ($) $ in Millions Current assets: Cash and cash equivalents Short-term investments Accounts receivable, net Inventories Prepaid Expense and Other Assets, Current Total current assets Long-term investments Equity and cost investments Property, plant and equipment, net Deferred income taxes, net Other long-term assets Other intangible assets Goodwill TOTAL ASSETS Current liabilities: Accounts payable Accrued liabilities Insurance reserves Stored value card liability Current portion of long-term debt Total current liabilities Long-term debt Deferred Revenue, Noncurrent Deferred Tax and Other Liabilities, Noncurrent Total liabilities Shareholders' equity: Common stock ($0.001 par value) - authorized, 2,400.0 shares; issued and outstanding, 1 460 5 and 1 485 1 shares respectively $ 8,756.3 181.5 693.1 1,400.5 1,462.8 12,494.2 267.7 334.7 5,929.1 134.7 412.2 1,042.2 3,541.6 24,156.4 $ 2,462.3 228.6 870.4 1,364 358.1 5,283.4 542.3 481.6 4,919.5 795.4 362.8 441.4 1,539.2 14,365.6 1,179.3 2,298.4 213.7 1,642.9 349.9 5,684.2 9,090.2 6,775.7 1,430.5 22,980.6 782.5 1,934.5 215.2 1,288.5 0 4,220.7 3,932.6 4.4 750.9 8,908.6 1.3 1.4 1.3 1.4 Shareholders' equity: Common stock ($0.001 par value) - authorized, 2,400.0 shares; issued and outstanding, 1,460.5 and 1,485.1 shares, respectively Additional paid-in capital Retained earnings Accumulated other comprehensive income/loss) Total shareholders' equity Noncontrolling interests Total equity TOTAL LIABILITIES AND EQUITY 41.1 1,457.4 (330.3) 1,169.5 6.3 1,175.8 $ 24,156.4 41.1 5,563.2 (155.6) 5,450.1 6.9 5,457 $ 14,365.6