Answered step by step
Verified Expert Solution
Question
1 Approved Answer
calculate the following for year 2018 and 2019: (with detail of calculation step by step) 1. Net Profit margin 2. Return on Capital Employed 3.
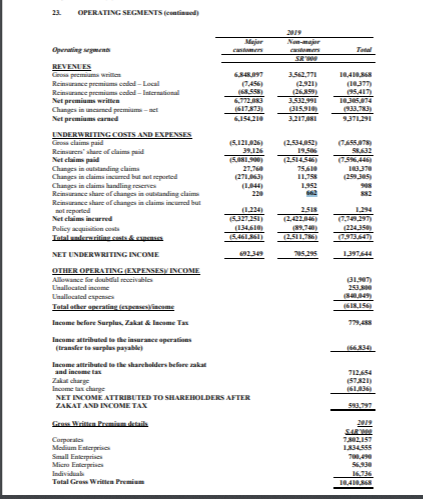
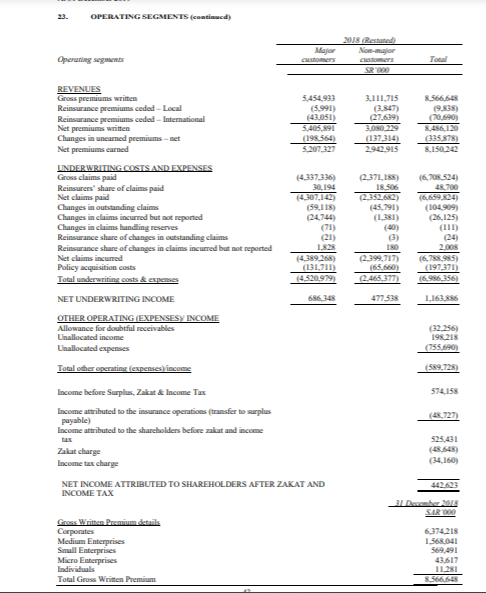
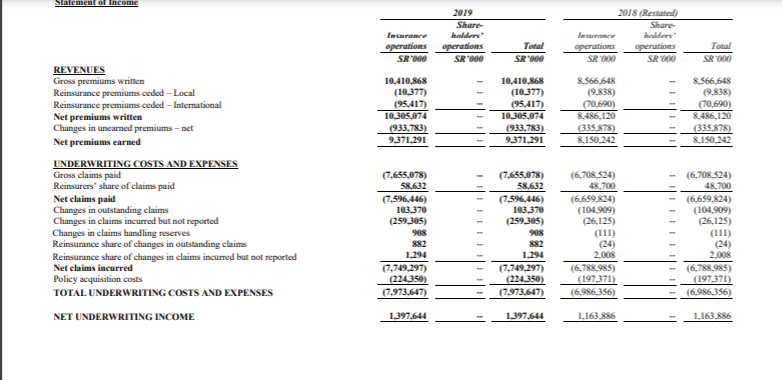
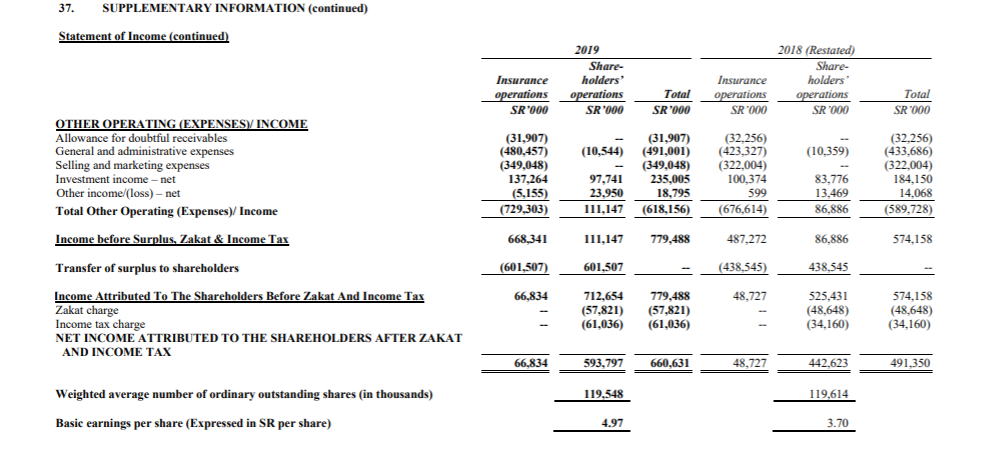
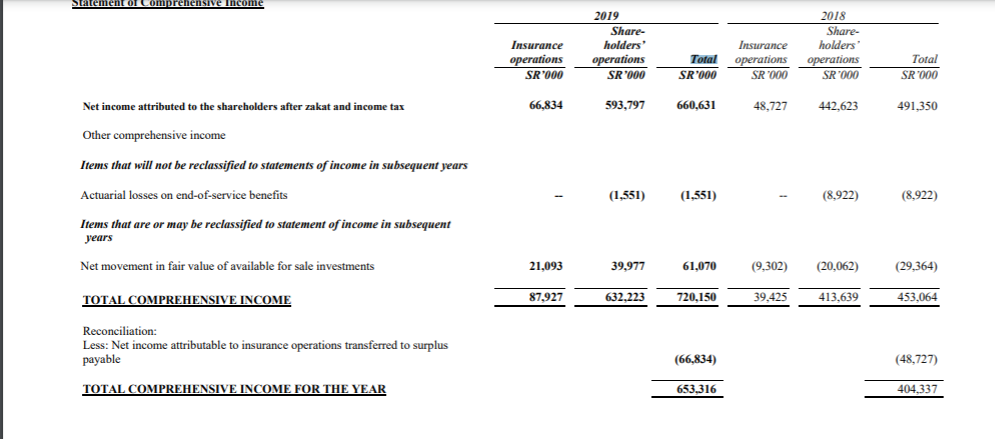
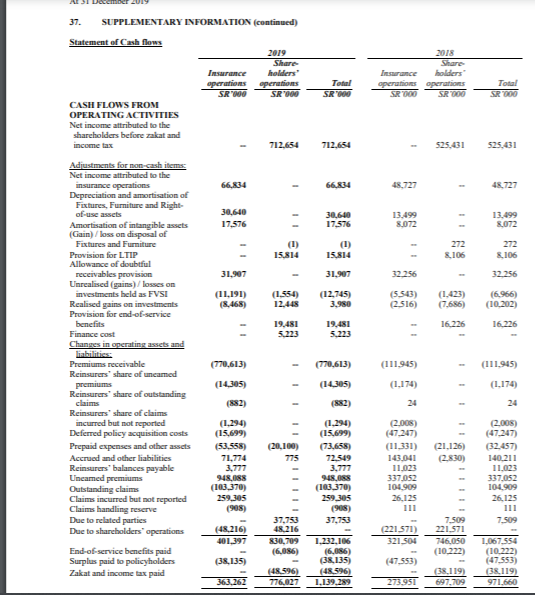
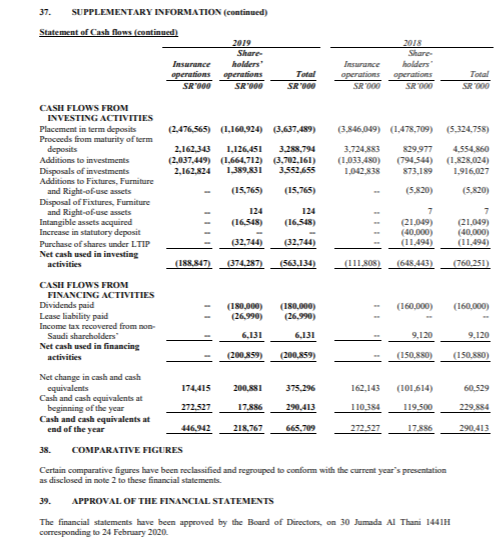
calculate the following for year 2018 and 2019:
(with detail of calculation step by step)
1. Net Profit margin
2. Return on Capital Employed
3. Loan to Assets Ratio
4. Return on Assets
5. Net Interest margin
6. Operating Leverage
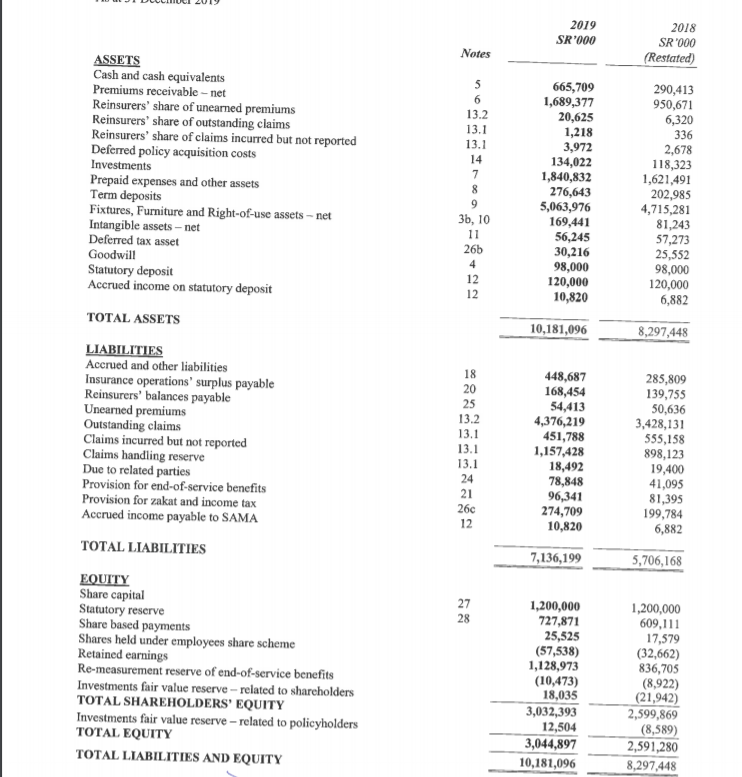
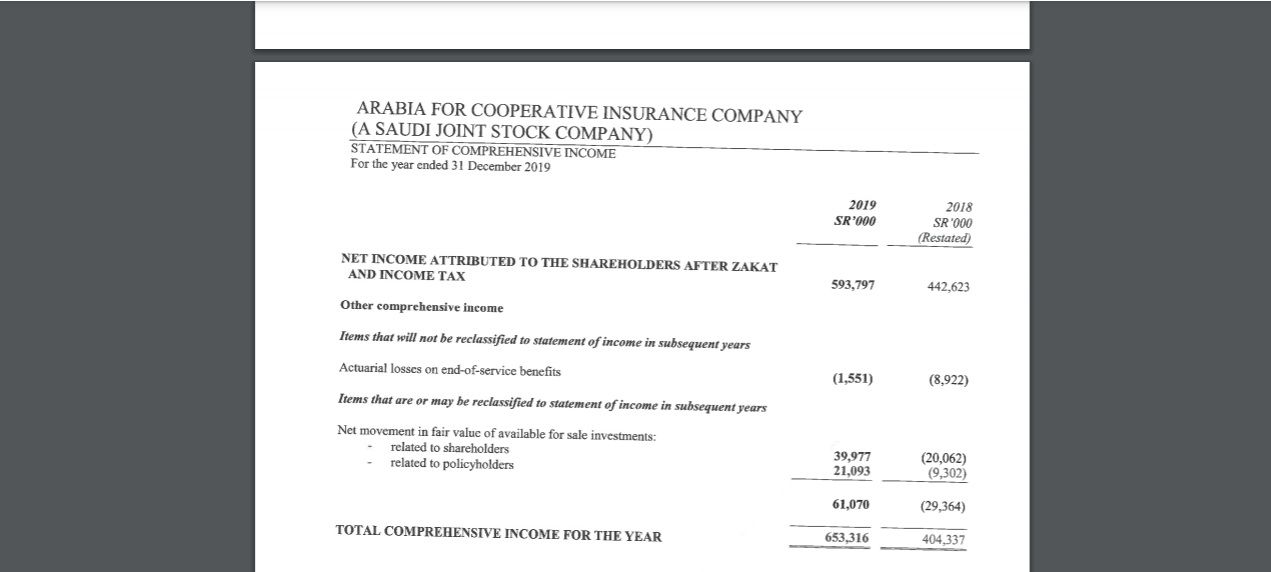
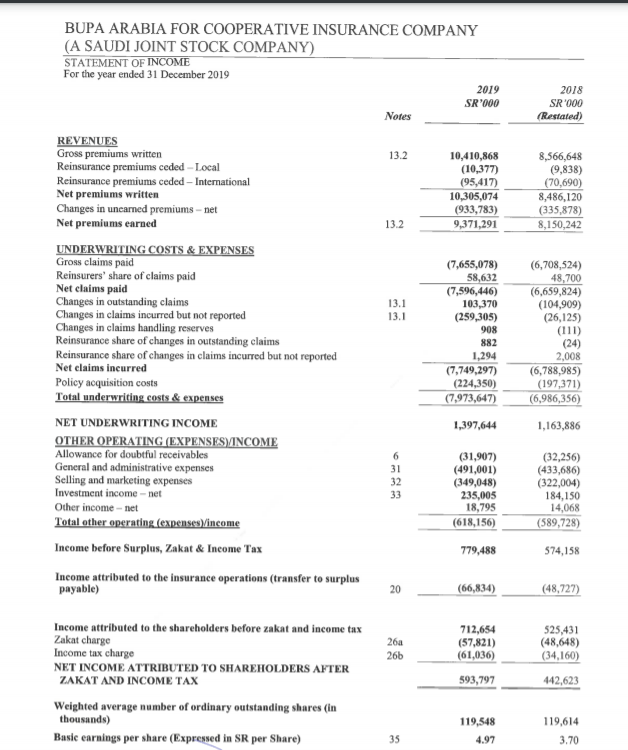
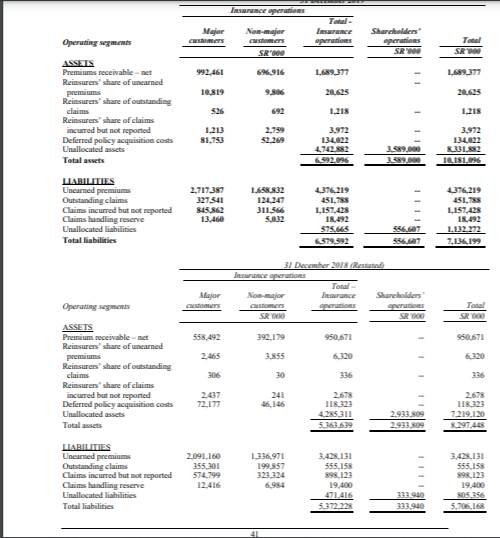
2019 SR'000 2018 SR '000 (Restated) Notes 5 ASSETS Cash and cash equivalents Premiums receivable -- net Reinsurers' share of unearned premiums Reinsurers' share of outstanding claims Reinsurers' share of claims incurred but not reported Deferred policy acquisition costs Investments Prepaid expenses and other assets Term deposits Fixtures, Furniture and Right-of-use assets - net Intangible assets -net Deferred tax asset Goodwill Statutory deposit Accrued income on statutory deposit 5 6 13.2 13.1 13.1 14 7 8 9 3b, 10 11 26b 4 12 12 665,709 1,689,377 20,625 1,218 3,972 134,022 1,840,832 276,643 5,063,976 169,441 56,245 30,216 98,000 120,000 10,820 290,413 950,671 6,320 336 2,678 118,323 1,621,491 202,985 4,715,281 81,243 57,273 25,552 98,000 120,000 6,882 TOTAL ASSETS 10,181,096 8,297,448 LIABILITIES Accrued and other liabilities Insurance operations' surplus payable Reinsurers' balances payable Unearned premiums Outstanding claims Claims incurred but not reported Claims handling reserve Due to related parties Provision for end-of-service benefits Provision for zakat and income tax Accrued income payable to SAMA TOTAL LIABILITIES 18 20 25 13.2 13.1 13.1 13.1 24 21 266 12 448,687 168,454 54,413 4,376,219 451,788 1,157,428 18,492 78,848 96,341 274,709 10,820 285,809 139,755 50,636 3,428,131 555,158 898,123 19,400 41,095 81,395 199,784 6,882 7,136,199 5,706,168 27 28 EQUITY Share capital Statutory reserve Share based payments Shares held under employees share scheme Retained earnings Re-measurement reserve of end-of-service benefits Investments fair value reserve - related to shareholders TOTAL SHAREHOLDERS' EQUITY Investments fair value reserve related to policyholders TOTAL EQUITY TOTAL LIABILITIES AND EQUITY 1,200,000 727,871 25,525 (57,538) 1,128,973 (10,473) 18,035 3,032,393 12,504 3,044,897 10,181,096 1,200,000 609,111 17,579 (32,662) 836,705 (8,922) (21,942) 2,599,869 (8,589) 2,591,280 8,297,448 ARABIA FOR COOPERATIVE INSURANCE COMPANY (A SAUDI JOINT STOCK COMPANY) STATEMENT OF COMPREHENSIVE INCOME For the year ended 31 December 2019 2019 SR'000 2018 SR'000 (Restated) NET INCOME ATTRIBUTED TO THE SHAREHOLDERS AFTER ZAKAT AND INCOME TAX 593,797 442,623 Other comprehensive income Items that will not be reclassified to statement of income in subsequent years Actuarial losses on end-of-service benefits (1,551) (8,922) Items that are or may be reclassified to statement of income in subsequent years Net movement in fair value of available for sale investments: related to shareholders related to policyholders 39,977 21,093 (20,062) (9,302) 61,070 (29,364) TOTAL COMPREHENSIVE INCOME FOR THE YEAR 653,316 404,337 BUPA ARABIA FOR COOPERATIVE INSURANCE COMPANY (A SAUDI JOINT STOCK COMPANY) STATEMENT OF INCOME For the year ended 31 December 2019 2019 SR'000 2018 SR '000 (Restated) Notes 13.2 10,410,868 (10,377) (95,417) 10,305,074 (933,783) 9,371,291 8,566,648 (9,838) (70,690) 8,486,120 (335,878) 8,150,242 13.2 (7,655,078) 58,632 (7,596,446) 103,370 (259,305) 13.1 13.1 908 REVENUES Gross premiums written Reinsurance premiums ceded - Local Reinsurance premiums ceded - International Net premiums written Changes in uncanned premiums-net Net premiums earned UNDERWRITING COSTS & EXPENSES Gross claims paid Reinsurers' share of claims paid Net claims paid Changes in outstanding claims Changes in claims incurred but not reported Changes in claims handling reserves Reinsurance share of changes in outstanding claims Reinsurance share of changes in claims incurred but not reported Net claims incurred Policy acquisition costs Total underwriting costs & expenses NET UNDERWRITING INCOME OTHER OPERATING (EXPENSES)/INCOME Allowance for doubtful receivables General and administrative expenses Selling and marketing expenses Investment income - net Other income-net Total other operating (expenses income Income before Surplus, Zakat & Income Tax Income attributed to the insurance operations (transfer to surplus payable) (6,708,524) 48,700 (6,659,824) (104,909) (26,125) (111) (24) 2,008 (6,788,985) (197,371) (6,986,356) 882 1,294 (7,749,297) (224,350) (7,973,647) 1,397,644 1,163,886 6 31 32 33 (31,907) (491,001) (349,048) 235,005 18,795 (618,156) (32,256) (433,686) (322,004) 184,150 14,068 (589,728) 779,488 574,158 20 (66,834) (48,727) 26a 26b 712,654 (57,821) (61,036) 525,431 (48,648) (34,160) Income attributed to the shareholders before zakat and income tax Zakat charge Income tax charge NET INCOME ATTRIBUTED TO SHAREHOLDERS AFTER ZAKAT AND INCOME TAX Weighted average number of ordinary outstanding shares (In thousands) Basic earnings per share (Expressed in SR per Share) 593,797 442,623 119,548 4.97 119,614 3.70 35 In operations Major Customers Non-major Operating mons operations Sharchons pios SR300 SR SR 900 992.461 1.689 377 696,916 9.806 1,689,377 20.625 10.819 ASSETS Premiums receivable -net Reinsurers' share of unearned premium Reinsurers' share of outstanding claims Reinsurers' share of claims incurred but not reported Deferred policy acquisition costs Unallocated assets Total assets 1.218 1.218 1.213 81,753 3.972 134,022 4.742.82 392.096 3.972 134,022 8331.482 10.181.096 LLABILITIES Unearmed premiums Outstanding claims Claims incurred but not reported Claims handling reserve Unallocated liabilities Total liabilities 2,717,387 327341 845.862 13,460 1.638.832 124.247 311.566 5.632 076219 451,788 1,157,428 18.492 S75.665 6579_992 76219 451,788 1.157.428 18.492 L132272 7.136.199 556.007 31 December 2018 Bestated Insurance Nomor Total Iesarance Major customers Operating segments Shareholders pratos SR 1000 Total SR 200 SR 000 558,492 950.671 950.671 392,179 3.855 2,465 6.320 ASSETS Premium receivable -net Reinsurers' share of unearned premiums Reinsurers' share of outstanding claims Reinsurers' share of claims incurred but not reported Deferred policy acquisition costs Unallocated assets Total assets 306 30 336 336 2,437 72.177 241 46,146 2.678 118.323 4.285311 5.163.639 2.933.809 2911 09 2.678 118 323 7219.120 8.297.448 LLABILITIES Unearmed premiums Outstanding claims Claims incurred but not reported Claims handling reserve Unallocated liabilities Total liabilities 2,091,160 355 301 574.799 12.416 1.336,971 199.857 323 324 555.158 98.123 19,400 3.428.131 555.158 998.123 19,400 305.356 5.706.168 331 90 333.940 53727 OPERATING SEGMENTS 29 T SR 3.562.771 (1037) 95.417) 3.502.991 15.910 3217 937291 (2.5145 75.610 11.758 1337 Operating we REVENUES Cene premam Repremium - Local Reimane premium clied - Internal 188558) Net premium written Changes in come premium -al Net premiumscared 6.15 UNDERWRITING COSTS AND EXPENSES Grossima 15.121.026 Renee of champaid 39.136 Netcampaid SIIS Changes in outstanding claim Changes in diminated but seperted Changes in claims handling rev Reinsurances of changinding claim Rannelse af changes in claiminame but Net claims incurred Policy (134061 Tutal andersins cits capes NET UNDERWRITING INCOME OTHER OPERATING EXPENSES, INCOME Allowance for alle despieme Total trening spesiems Income before Surplus, Zakat & Income Tax Income attributed to the pas transfer terlepas) Income attributed to the shareholders before make and income tas Image MET INCOME ATTRIBUTED TO SHAREHOLDERS AFTER (1973 1397544 31.90) 712.654 2019 SA 7015 1334555 Carperie Melampe Small Filem Mic 16.136 Total Grow Written Premium OPERATING SEGMENTS continued) 2018 Restated Non- Operating segments REVENUES Gross premiums written Reinsurance premiums ceded - Local Reinsurance premium ceded - International Net premiums written Changes in neamed premiums het Net premiums earned 3,111,715 (3.847) (27.639) 19.838 70.690 5.454933 (5.991) (43_051) 5,405.891 (198564) 5.207.327 335.878) (137314) 2.902.915 (2.371.188) IR 506 48.700 (45.791) (1.381) (40) 3) (104.909) (26.125) 24) 2.008 (2.399,717) (65.660) (2.465,377) (197.371) (6.986 356 477538 1.163.885 UNDERWRITING COSTS AND EXPENSES Gross claims paid (4-337.316) Reinsurers' share of claims paid 30,194 Net claims paid (4.307.142) Changes in outstanding claims (59.118) Changes in claims incurred but not reported Changes in claims handling reserves (71) Reinsurance share of changes in outstanding claims (21) Reinsurance share of changes in claims incurred but not reported LO Net claims incurred (4.389.268) Policy acquisition costs (131.711) Total underwunting costs & expenses 14520979 NET UNDERWRITING INCOME 686 2 OTHER OPERATING (EXPENSESY INCOME Allowance for doubtful receivables Unallocated income Unallocated expenses Total other operating (expenses) income Income before Surplus, Zakat & Income Tax Income attributed to the insurance operations (transfer to splus payable) Income attributed to the shareholders before zakat and income Zakat charge Income tax charge NET INCOME ATTRIBUTED TO SHAREHOLDERS AFTER ZAKAT AND 198218 (755.690) (589.728 574,158 (48.727) 525.431 (34.160) 31 December 2015 SAR DOO Gross Written Premium details Corporates Medium Enterprises Small Enterprises Micro Enterprises lindividuals Total Gross Written Premium 6374218 1.568.041 569,491 43.617 11.281 S566,648 Statement ol Incom 2019 Share Ingre holder operations operations SR SR600 2018 (Restated) Share holders operations operations SR000 SR200 Total SR000 Total SR 000 10.410.868 (10,377) (95,417) 10.305,074 (933.783) 9.371.291 10.410.868 (10.377) (95.417) 10.305,074 (933,783) 9371,291 & $66.648 (9.838) (70.690) 8,486,120 (335.878) &.150.242 8.566.648 (9.838) (70.690) 8,486,120 (335.878) &.150.242 REVENUES Gross premiums written Reinsurance premiums ceded - Local Reinsurance premiums ceded - International Net premiums written Changes in unearned premiums-net Net premiums earned UNDERWRITING COSTS AND EXPENSES Gross claims paid Reinsurers' share of claims paid Net claims paid Changes in outstanding claims Changes in claims incurred but not reported Changes in claims handling reserves Reinsurance share of changes in outstanding claims Reinsurance share of changes in claims incurred but not reported Net claims incurred Policy acquisition costs TOTAL UNDERWRITING COSTS AND EXPENSES NET UNDERWRITING INCOME (7.655,078) 58,632 (7,596,446) 103,370 (2.59.305) 908 882 1.294 (7,749,297) (224,350) (1.973,647) (7.655,078) 58.632 (7.596,446) 103.370 (259,305) 908 (6,708 524) 48.700 (6.659.824) (104.909) (26,125) (111) (24) 2.008 (6.788.985) (197371) (6,986,356) (6.708 524) 48.700 (6.659.824) (104.909) (26.125) (111) (24) 2,008 (6.788.985) (197371) (6,986,356) 1.294 (7,749,297) (224.350) (7.973.647) 1.397.644 1.397,614 1.163.886 1.163.886 37. SUPPLEMENTARY INFORMATION (continued) Statement of Income (continued) Insurance operations SR'000 2019 Share- holders operations SR '000 2018 (Restated) Share- holders operations SR000 Insurance operations SR '000 Total SR'000 Total SR 000 (10,544) (10,359) OTHER OPERATING (EXPENSES) INCOME Allowance for doubtful receivables General and administrative expenses Selling and marketing expenses Investment income-net Other income (loss) - net Total Other Operating (Expenses)/ Income (31,907) (480,457) (349,048) 137.264 (5,155) (729,303) 97,741 23,950 111,147 (31,907) (491,001) (349,048) 235,005 18,795 (618,156) (32,256) (423,327) (322.004) 100.374 599 (676,614) 83,776 13.469 86,886 (32,256) (433,686) (322,004) 184,150 14,068 (589,728) Income before Surplus, Zakat & Income Tax 668.341 111,147 779,488 487.272 86.886 574,158 Transfer of surplus to shareholders (601,507) 601,507 (438,545) 438.545 66,834 48,727 Income Attributed To The Shareholders Before Zakat And Income Tax Zakat charge Income tax charge NET INCOME ATTRIBUTED TO THE SHAREHOLDERS AFTER ZAKAT AND INCOME TAX 712,654 (57,821) (61,036) 779,488 (57,821) (61,036) 525.431 (48,648) (34,160) 574,158 (48,648) (34,160) 66,834 593,797 660.631 48,727 442.623 491.350 Weighted average number of ordinary outstanding shares (in thousands) 119,548 119,614 Basic earnings per share (Expressed in SR per share) 4.97 3.70 Statement of comprehensive Incom Insurance operations SR'000 2019 Share- holders operations SR'000 2018 Share- holders operations SR 000 Insurance operations SR 1000 Total SR'000 Total SR000 Net income attributed to the shareholders after zakat and income tax 66,834 593,797 660,631 48.727 442,623 491,350 Other comprehensive income Items that will not be reclassified to statements of income in subsequent years Actuarial losses on end-of-service benefits -- (1,551) ) (1,551) (8,922) (8,922) Items that are or may be reclassified to statement of income in subsequent years Net movement in fair value of available for sale investments 21,093 39,977 61,070 (9,302) (20,062) (29,364) TOTAL COMPREHENSIVE INCOME 87,927 632.223 720,150 39,425 413,639 453,064 Reconciliation: Less: Net income attributable to insurance operations transferred to surplus payable (66,834) (48,727) TOTAL COMPREHENSIVE INCOME FOR THE YEAR 653,316 404.337 2018 Share holders operations operations SR 1000 SR 1000 Total SR Total SR2000 712.654 525.431 525.431 66.834 48,727 48.727 1 30,640 17,576 13,499 8.072 13.499 8,072 (1) 15.814 272 8.105 272 8.106 31,907 32.256 32.256 37. SUPPLEMENTARY INFORMATION (continued) Statement of Cash flows 2019 Share Tresurance holders operations operations SR"000 SR000 CASH FLOWS FROM OPERATING ACTIVITIES Net income attributed to the shareholders before zakat and income tax 712.654 Adjustments for non-cash items Net income attributed to the insurance operations 66,834 Depreciation and amortisation of Fixtures, Furniture and Right of-use assets 30,640 Amortisation of intangible assets 17,576 (Gain) / loss on disposal of Fixtures and Furniture Provision for LTIP 15.814 Allowance of doubtful receivables provision 31,907 Unrealised gains) / losses on investments held as FVSI (11,191) (1.554) Realised gains on investments (8.468) 12.448 Provision for end-of-service benefits 19,481 Finance cost 5.223 Changes in operating assets and liabilities: Premiums receivable (770,613) Reinsurers' share of uncamed premiums (14.305) Reinsurers' share of outstanding claims (882) Reinsurers' share of claims incurred but not reported (1.294) Deferred policy acquisition costs (15,699) Prepaid expenses and other assets (53.558) (20.100) Accrued and other liabilities 71,774 775 Reinsurers balances payable 3,777 Uneamed premium 948,088 Outstanding claims (103,370) Claims incurred but not reported 259,305 Claims handling reserve (908) Due to related parties 37,753 Due to shareholders' operations (48,216) 48.216 401.397 830,709 End-of-service benefits paid (6.086) Surplus paid to policyholders (38,135) Zakat and income tax paid (48_596) 776,027 (12,745) 3,980 (5543) 2.516) (1,423) (7.686) (6.966) (10_202) 16.226 16.226 19,481 5.223 (770,613) (111.945) (111.945) (14.305) (1.174) (1.174) - (882) 24 24 (1.294) (15,699) (73.658) 72,549 3,777 948.088 (103370) 259305 (908) 37,753 (2.008) (47.247) (11,331) 143.041 11.023 337,052 104.909 26.125 (21,126) (2.830) (2.008) (47.247) (32.457) 140.211 11.023 337,052 104.909 26.125 7.509 (221.571) 321.504 7509 221.571 746,050 (10.222) 1,232,106 16.086) (38,135) (48_596) 1.139.289 (47,553) 1.067.554 (10.222) (47.553) (38,119) 971,660 273.951 38.119 697.709 2018 37. SUPPLEMENTARY INFORMATION (continued) Statement of Cash flows (continued) 2019 Share Insurance holders operations operations SR200 SR900 Total SR200 operations SR000 holders operations SR 600 Total SR300 (5.324,758) (2,476,565) (1.160,924) (3.637,489) 2,162.343 1,126,451 3.288,794 (2,037,449) (1,664,712) (3,702,161) 2,162.824 1.389.831 3.552.655 (3.846,049) (1,478,709) 3.724.883 $29.977 (1,033,480) (794544) 1.0442.838 873.189 4,554.860 (1.828.024) 1,916,027 CASH FLOWS FROM INVESTING ACTIVITIES Placement in term deposits Proceeds from maturity of term deposits Additions to investments Disposals of investments Additions to Fixtures, Furniture and Right-of-use assets Disposal of Fixtures, Furniture and Right-of-use assets Intangible assets acquired Increase in statutory deposit Purchase of shares under LTIP Net cash used in investing activities (15.765) (15,765) (5.820) (5.820) 124 (16.548) 124 (16.548) 7 (21.049) (40.000) (11.494) 7 (21.049) (40,000) (11.494) (32.744) (32.741) (563.134) (188.847) (374.287) (111.80 (648.443) (760.251) (180,000) (26.990) CASH FLOWS FROM FINANCING ACTIVITIES Dividends paid Lease liability paid Income tax recovered from non- Saudi shareholders Net cash used in financing activities (180,000) (26.990) (160,000) (160.000) 6.131 6,131 9,120 9,120 (200.859) (200.859) (150.880) (150.80) 200.881 375.296 162.143 (101.614) 60.529 17.886 290.413 110384 Net change in cash and cash equivalents 174.415 Cash and cash equivalents at beginning of the year 272.527 Cash and cash equivalents at end of the year 446,942 38. COMPARATIVE FIGURES 119.500 229.884 218,767 665.709 272.527 17.886 290,413 Certain comparative figures have been reclassified and regrouped to conform with the current year's presentation as disclosed in note 2 to these financial statements 39. APPROVAL OF THE FINANCIAL STATEMENTS The financial statements have been approved by the Board of Directors, on 30 Jumada Al Thani 1441H corresponding to 24 February 2020
Step by Step Solution
There are 3 Steps involved in it
Step: 1

Get Instant Access to Expert-Tailored Solutions
See step-by-step solutions with expert insights and AI powered tools for academic success
Step: 2

Step: 3

Ace Your Homework with AI
Get the answers you need in no time with our AI-driven, step-by-step assistance
Get Started


