 Calculate the following, please show the formula...
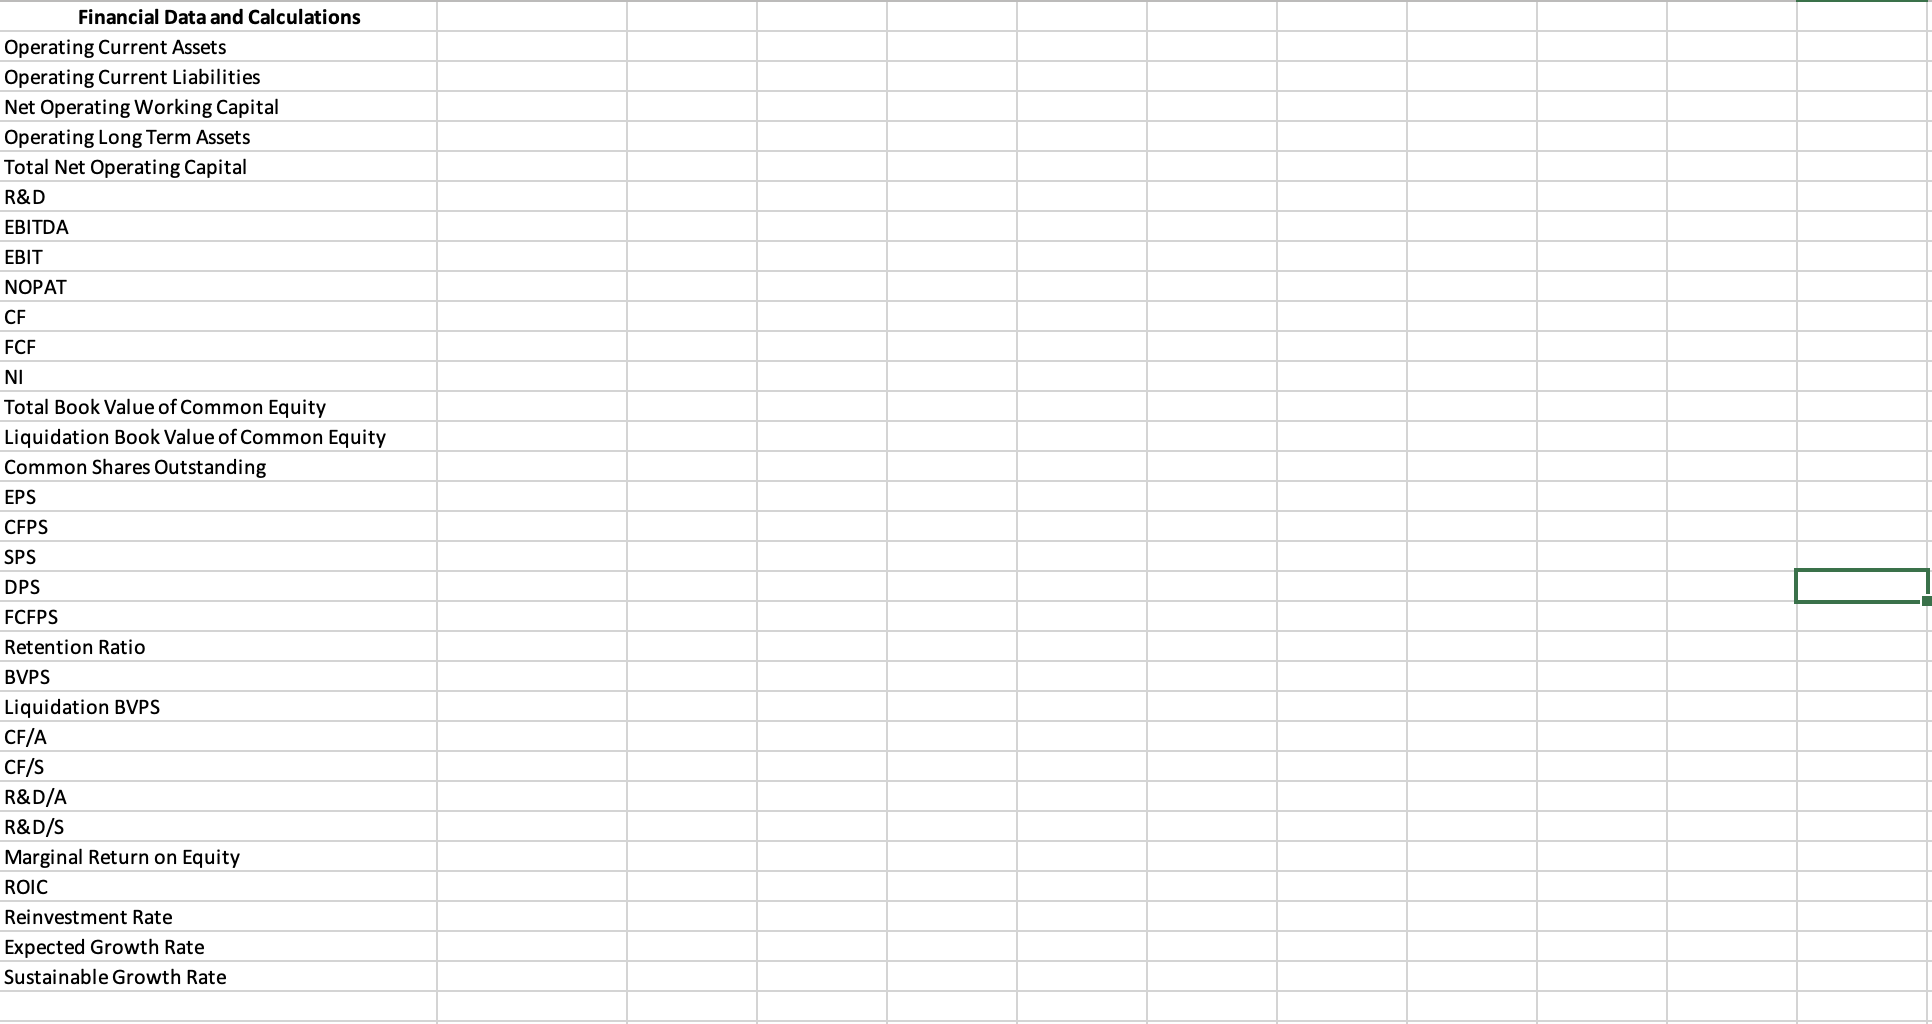 PLEASE SHOW THE FORMULA.
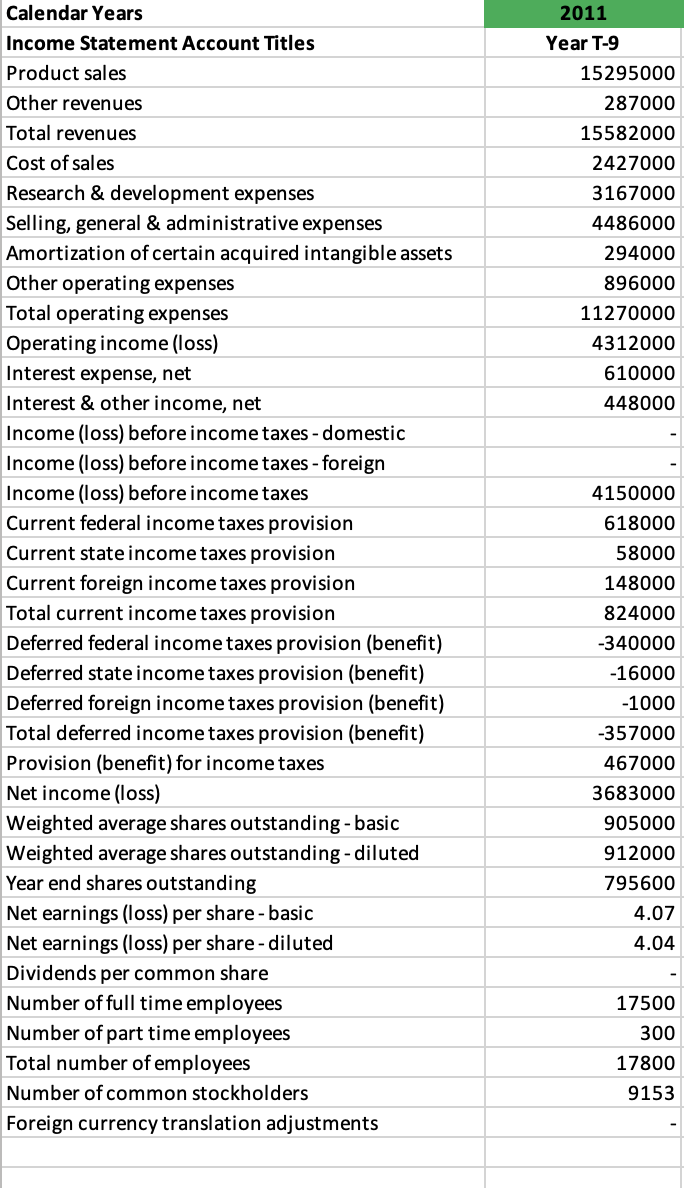
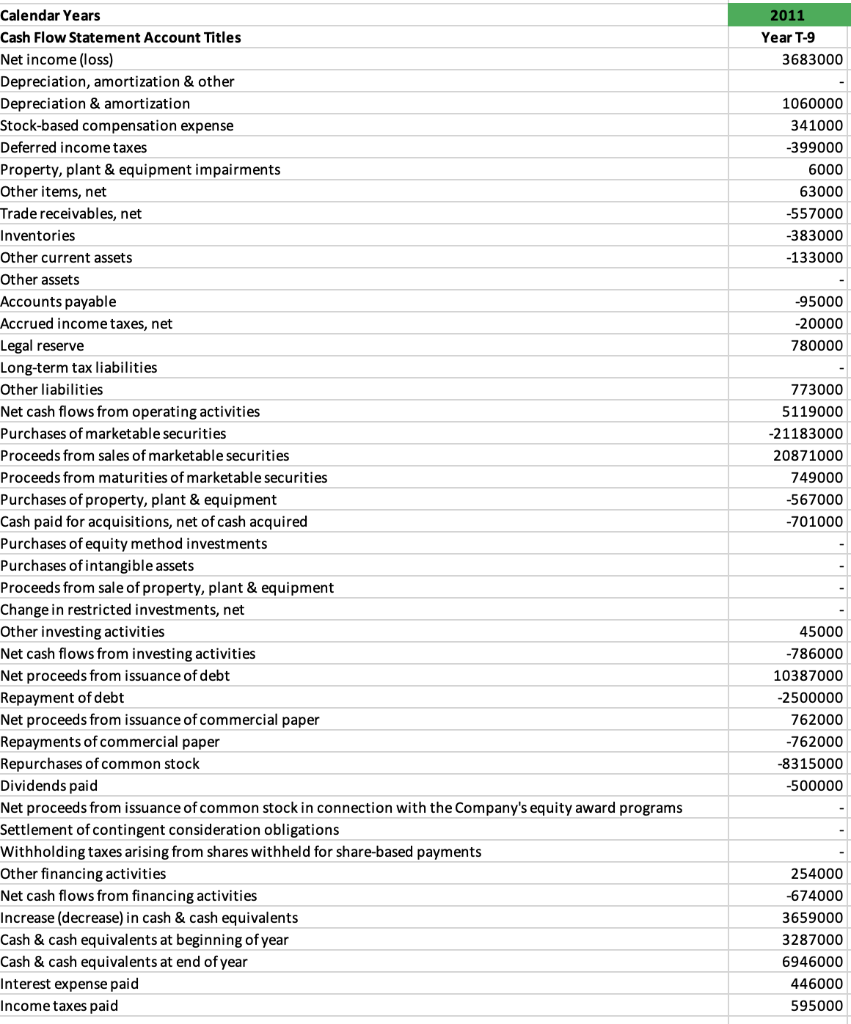
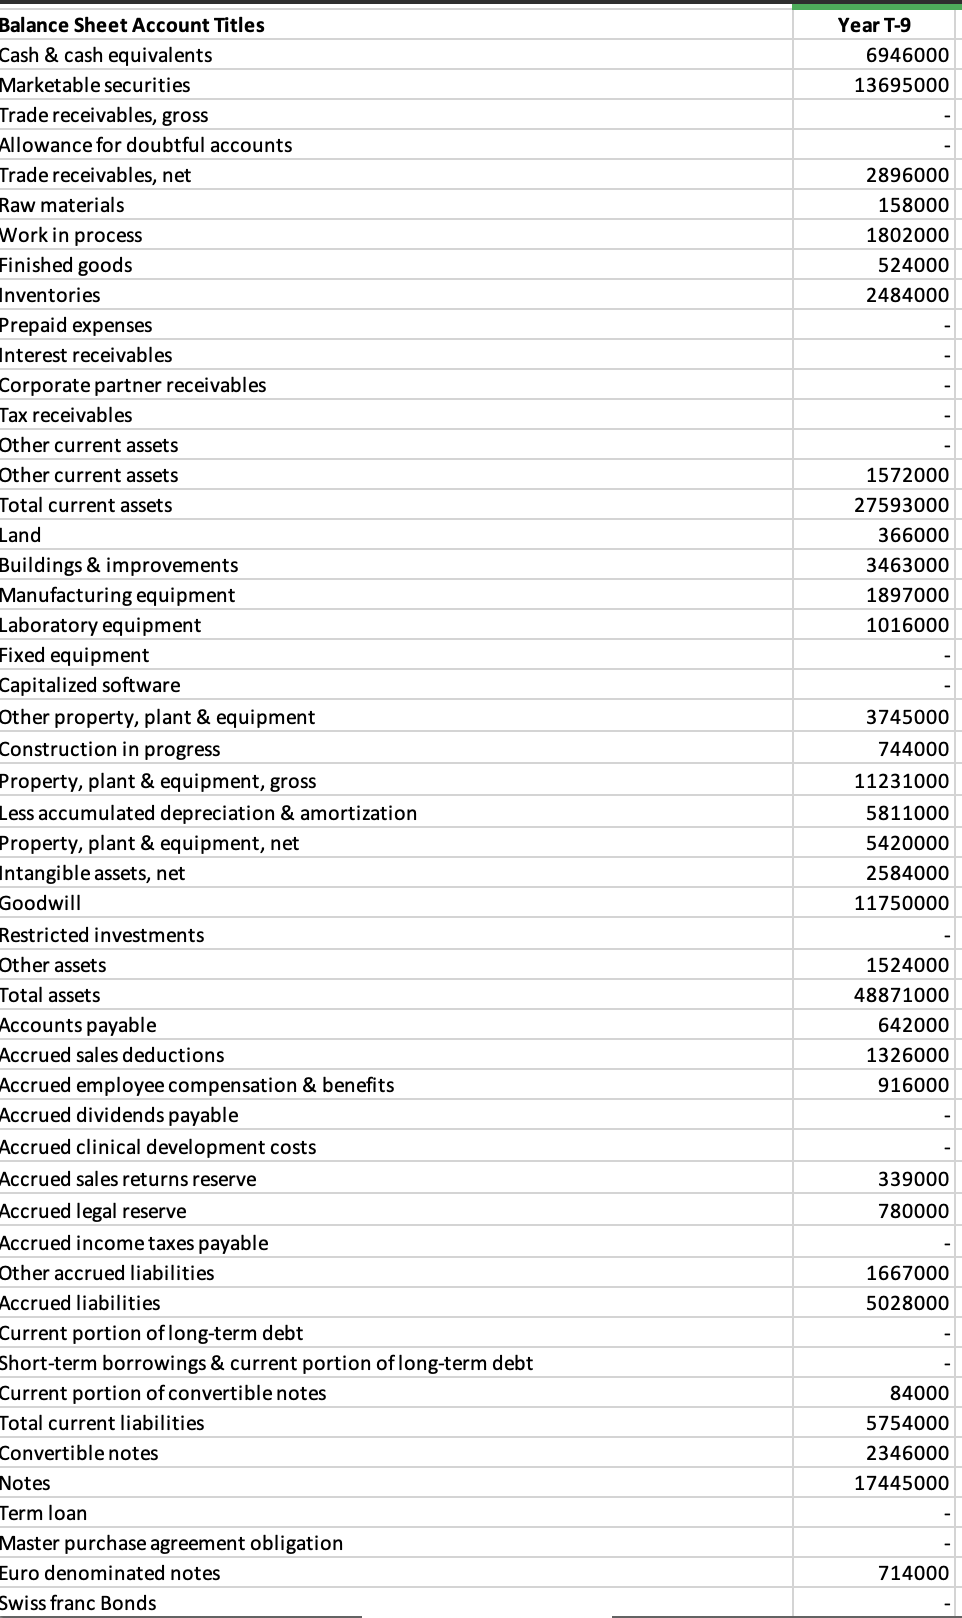
2011 Year T-9 15295000 287000 15582000 2427000 3167000 4486000 294000 896000 11270000 4312000 610000 448000 Calendar Years Income Statement Account Titles Product sales Other revenues Total revenues Cost of sales Research & development expenses Selling, general & administrative expenses Amortization of certain acquired intangible assets Other operating expenses Total operating expenses Operating income (loss) Interest expense, net Interest & other income, net Income (loss) before income taxes - domestic Income (loss) before income taxes - foreign Income (loss) before income taxes Current federal income taxes provision Current state income taxes provision Current foreign income taxes provision Total current income taxes provision Deferred federal income taxes provision (benefit) Deferred state income taxes provision (benefit) Deferred foreign income taxes provision (benefit) Total deferred income taxes provision (benefit) Provision (benefit) for income taxes Net income (loss) Weighted average shares outstanding - basic Weighted average shares outstanding - diluted Year end shares outstanding Net earnings (loss) per share-basic Net earnings (loss) per share-diluted Dividends per common share Number of full time employees Number of part time employees Total number of employees Number of common stockholders Foreign currency translation adjustments 4150000 618000 58000 148000 824000 -340000 -16000 -1000 -357000 467000 3683000 905000 912000 795600 4.07 4.04 17500 300 17800 9153 2011 Year T-9 3683000 1060000 341000 -399000 6000 63000 -557000 -383000 -133000 -95000 -20000 780000 Calendar Years Cash Flow Statement Account Titles Net income (loss) Depreciation, amortization & other Depreciation & amortization Stock-based compensation expense Deferred income taxes Property, plant & equipment impairments Other items, net Trade receivables, net Inventories Other current assets Other assets Accounts payable Accrued income taxes, net Legal reserve Long-term tax liabilities Other liabilities Net cash flows from operating activities Purchases of marketable securities Proceeds from sales of marketable securities Proceeds from maturities of marketable securities Purchases of property, plant & equipment Cash paid for acquisitions, net of cash acquired Purchases of equity method investments Purchases of intangible assets Proceeds from sale of property, plant & equipment Change in restricted investments, net Other investing activities Net cash flows from investing activities Net proceeds from issuance of debt Repayment of debt Net proceeds from issuance of commercial paper Repayments of commercial paper Repurchases of common stock Dividends paid Net proceeds from issuance of common stock in connection with the Company's equity award programs Settlement of contingent consideration obligations Withholding taxes arising from shares withheld for share-based payments Other financing activities Net cash flows from financing activities Increase (decrease) in cash & cash equivalents Cash & cash equivalents at beginning of year Cash & cash equivalents at end of year Interest expense paid Income taxes paid 773000 5119000 -21183000 20871000 749000 -567000 -701000 45000 -786000 10387000 -2500000 762000 -762000 -8315000 -500000 254000 -674000 3659000 3287000 6946000 446000 595000 Year T-9 6946000 13695000 2896000 158000 1802000 524000 2484000 1572000 27593000 366000 3463000 1897000 1016000 3745000 744000 11231000 Balance Sheet Account Titles Cash & cash equivalents Marketable securities Trade receivables, gross Allowance for doubtful accounts Trade receivables, net Raw materials Work in process Finished goods Inventories Prepaid expenses Interest receivables Corporate partner receivables Tax receivables Other current assets Other current assets Total current assets Land Buildings & improvements Manufacturing equipment Laboratory equipment Fixed equipment Capitalized software Other property, plant & equipment Construction in progress Property, plant & equipment, gross Less accumulated depreciation & amortization Property, plant & equipment, net angible assets, net Goodwill Restricted investments Other assets Total assets Accounts payable Accrued sales deductions Accrued employee compensation & benefits Accrued dividends payable Accrued clinical development costs Accrued sales returns reserve Accrued legal reserve Accrued income taxes payable Other accrued liabilities Accrued liabilities Current portion of long-term debt Short-term borrowings & current portion of long-term debt Current portion of convertible notes Total current liabilities Convertible notes Notes Term loan Master purchase agreement obligation Euro denominated notes Swiss franc Bonds 5811000 5420000 2584000 11750000 1524000 48871000 642000 1326000 916000 339000 780000 1667000 5028000 84000 5754000 2346000 17445000 714000 Financial Data and Calculations Operating Current Assets Operating Current Liabilities Net Operating Working Capital Operating Long Term Assets Total Net Operating Capital R&D EBITDA EBIT NOPAT CF FCF NI Total Book Value of Common Equity Liquidation Book Value of Common Equity Common Shares Outstanding EPS CFPS SPS DPS FCFPS Retention Ratio BVPS Liquidation BVPS CF/A CF/S R&D/A R&D/S Marginal Return on Equity ROIC Reinvestment Rate Expected Growth Rate Sustainable Growth Rate 2011 Year T-9 15295000 287000 15582000 2427000 3167000 4486000 294000 896000 11270000 4312000 610000 448000 Calendar Years Income Statement Account Titles Product sales Other revenues Total revenues Cost of sales Research & development expenses Selling, general & administrative expenses Amortization of certain acquired intangible assets Other operating expenses Total operating expenses Operating income (loss) Interest expense, net Interest & other income, net Income (loss) before income taxes - domestic Income (loss) before income taxes - foreign Income (loss) before income taxes Current federal income taxes provision Current state income taxes provision Current foreign income taxes provision Total current income taxes provision Deferred federal income taxes provision (benefit) Deferred state income taxes provision (benefit) Deferred foreign income taxes provision (benefit) Total deferred income taxes provision (benefit) Provision (benefit) for income taxes Net income (loss) Weighted average shares outstanding - basic Weighted average shares outstanding - diluted Year end shares outstanding Net earnings (loss) per share-basic Net earnings (loss) per share-diluted Dividends per common share Number of full time employees Number of part time employees Total number of employees Number of common stockholders Foreign currency translation adjustments 4150000 618000 58000 148000 824000 -340000 -16000 -1000 -357000 467000 3683000 905000 912000 795600 4.07 4.04 17500 300 17800 9153 2011 Year T-9 3683000 1060000 341000 -399000 6000 63000 -557000 -383000 -133000 -95000 -20000 780000 Calendar Years Cash Flow Statement Account Titles Net income (loss) Depreciation, amortization & other Depreciation & amortization Stock-based compensation expense Deferred income taxes Property, plant & equipment impairments Other items, net Trade receivables, net Inventories Other current assets Other assets Accounts payable Accrued income taxes, net Legal reserve Long-term tax liabilities Other liabilities Net cash flows from operating activities Purchases of marketable securities Proceeds from sales of marketable securities Proceeds from maturities of marketable securities Purchases of property, plant & equipment Cash paid for acquisitions, net of cash acquired Purchases of equity method investments Purchases of intangible assets Proceeds from sale of property, plant & equipment Change in restricted investments, net Other investing activities Net cash flows from investing activities Net proceeds from issuance of debt Repayment of debt Net proceeds from issuance of commercial paper Repayments of commercial paper Repurchases of common stock Dividends paid Net proceeds from issuance of common stock in connection with the Company's equity award programs Settlement of contingent consideration obligations Withholding taxes arising from shares withheld for share-based payments Other financing activities Net cash flows from financing activities Increase (decrease) in cash & cash equivalents Cash & cash equivalents at beginning of year Cash & cash equivalents at end of year Interest expense paid Income taxes paid 773000 5119000 -21183000 20871000 749000 -567000 -701000 45000 -786000 10387000 -2500000 762000 -762000 -8315000 -500000 254000 -674000 3659000 3287000 6946000 446000 595000 Year T-9 6946000 13695000 2896000 158000 1802000 524000 2484000 1572000 27593000 366000 3463000 1897000 1016000 3745000 744000 11231000 Balance Sheet Account Titles Cash & cash equivalents Marketable securities Trade receivables, gross Allowance for doubtful accounts Trade receivables, net Raw materials Work in process Finished goods Inventories Prepaid expenses Interest receivables Corporate partner receivables Tax receivables Other current assets Other current assets Total current assets Land Buildings & improvements Manufacturing equipment Laboratory equipment Fixed equipment Capitalized software Other property, plant & equipment Construction in progress Property, plant & equipment, gross Less accumulated depreciation & amortization Property, plant & equipment, net angible assets, net Goodwill Restricted investments Other assets Total assets Accounts payable Accrued sales deductions Accrued employee compensation & benefits Accrued dividends payable Accrued clinical development costs Accrued sales returns reserve Accrued legal reserve Accrued income taxes payable Other accrued liabilities Accrued liabilities Current portion of long-term debt Short-term borrowings & current portion of long-term debt Current portion of convertible notes Total current liabilities Convertible notes Notes Term loan Master purchase agreement obligation Euro denominated notes Swiss franc Bonds 5811000 5420000 2584000 11750000 1524000 48871000 642000 1326000 916000 339000 780000 1667000 5028000 84000 5754000 2346000 17445000 714000 Financial Data and Calculations Operating Current Assets Operating Current Liabilities Net Operating Working Capital Operating Long Term Assets Total Net Operating Capital R&D EBITDA EBIT NOPAT CF FCF NI Total Book Value of Common Equity Liquidation Book Value of Common Equity Common Shares Outstanding EPS CFPS SPS DPS FCFPS Retention Ratio BVPS Liquidation BVPS CF/A CF/S R&D/A R&D/S Marginal Return on Equity ROIC Reinvestment Rate Expected Growth Rate Sustainable Growth Rate