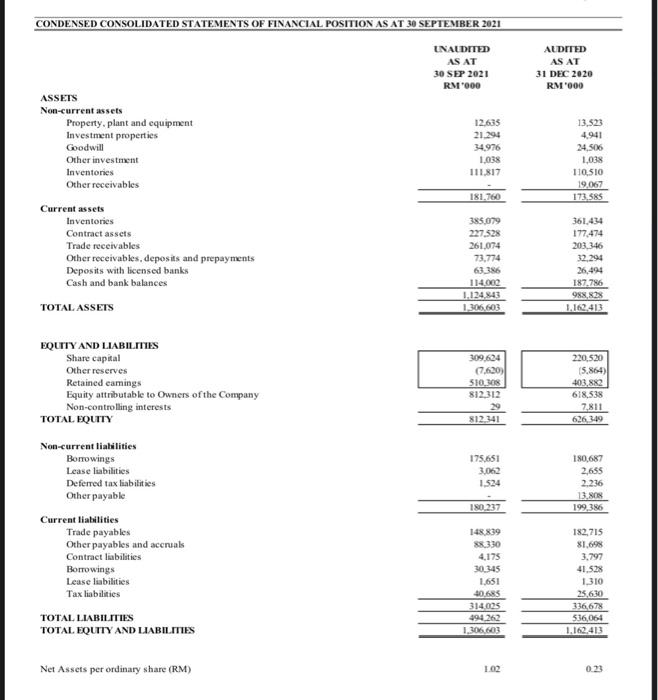
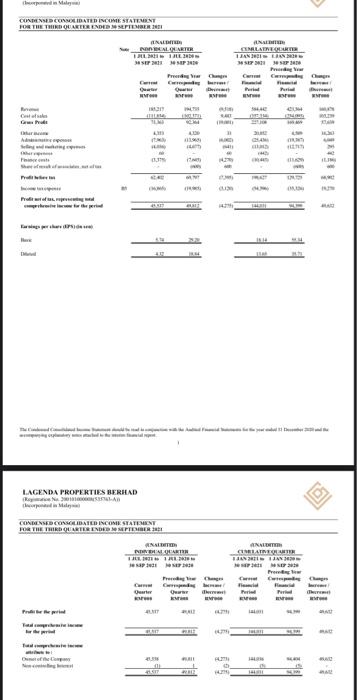
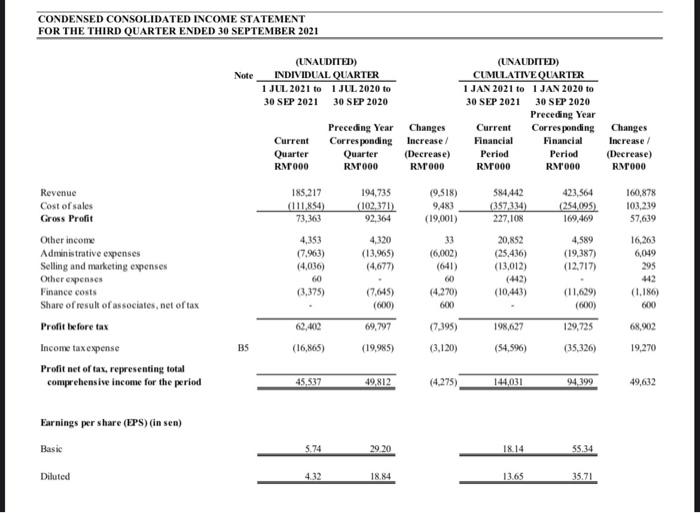
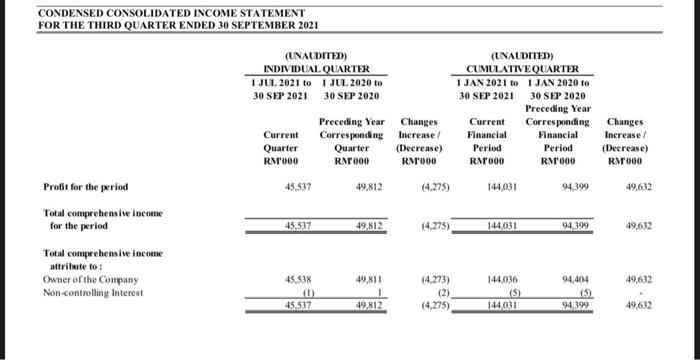
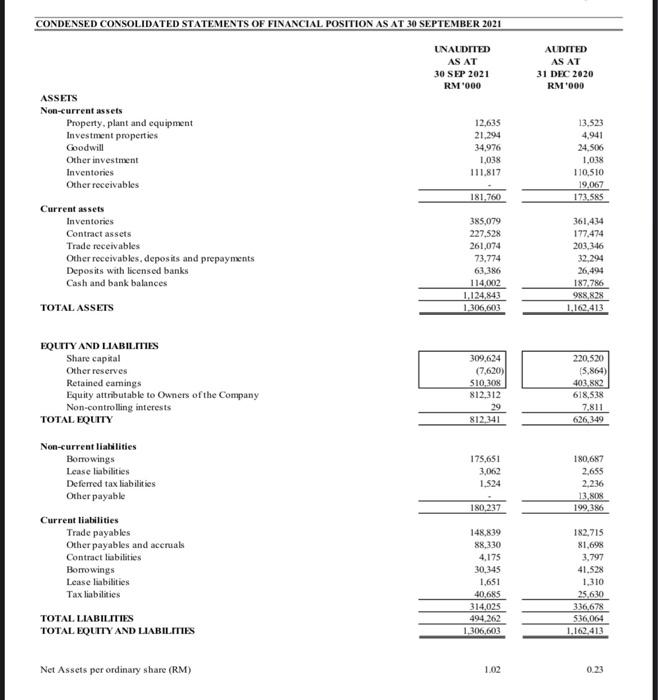
Calculate the following ratios based on the cumulative quarterly data spanning 1 Jan 2021 to 30 Sept 2021 of Lagenda Properties Berhad in the appendices. The closing stock price on 30 September 2021 of Lagenda was RM1.46 per share. The effective tax rate was 27%, while the depreciation expense for the cumulative quarter was recorded as RM1,761,000.
i. Average collection period
ii. Inventory turnover
iii. Debt-to-equity ratio
CONDENSED CONSOLIDATED STATEMENTS OF FINANCIAL POSITION AS AT 30 SEPTEMBER 2021 UNALDITED AS AT 30 SEP 2021 RM200 ALDITED AS AT 31 DEC 2020 RM 1000 ASSETS Non-current assets Property, plant and equipment Investment properties Goodwill Other investment Inventories Other receivables 12,635 21.294 34976 1.038 111.817 13,523 4941 24,506 1,038 110,510 19,067 172 585 181.760 Current assets Inventories Contract assets Trade receivables Other receivables, deposits and prepayments Deposits with licensed banks Cash and bank balances TOTAL ASSETS 385.079 227,528 261,074 73,774 63.386 114,062 1.124543 1,306,603 361.434 177.474 203.346 32,294 26,494 187.786 988,82% 1.162,413 EQUITY AND LIABILITIES Share capital Other reserves Retained eamings Equity attributable to Owners of the Company Non-controlling interests TOTAL EQUITY 309.624 (7.620) 510,308 812,312 29 812.341 220.520 15.864) 403,8X2 618,538 7811 626249 175.651 3.062 1.524 180,687 2,655 2.236 13.808 199,386 180.237 Non-current liabilities Borrowings Lease liabilities Deferred tax liabilities Other payable Current liabilities Trade payables Other payables and accruals Contract liabilities Borrowings Lease liabilities Tax liabilities 148 839 88330 4,175 30.345 1.651 40.685 314025 494262 1,306,603 182,715 81,098 3.797 41.528 1.310 25.630 336,67% 536,064 1.162,413 TOTAL LIABILITIES TOTAL EQUITY AND LIABILITIES Net Assets per ordinary share (RM) 1.02 0.23 CONDENSED CONSOLIDATED INCOME STATEMENT FOR THE THIRD OURERENDE SEPTEMBER INI NOLALAR TRB BRL SES CELATRERT LIABILE SET Pred German Cham C C Costa G A. re Pro TI LAGENDA PROPERTIES BERHAD LAN CONDENSED CONSOLIDATED INCOMIE STATEMENT FOR THE THIRDOURTEENDED SO SEPTEMBER 3 AN ANALI raman M. AM CILANTOLAT FRETTAM TIAN TA NE Free Carming met bere Orie Ow Turiu The 14 CONDENSED CONSOLIDATED INCOME STATEMENT FOR THE THIRD QUARTER ENDED 30 SEPTEMBER 2021 Note (UNAUDITED) INDIVIDUAL QUARTER 1 JUL 2021 to 1 JUL 2020 to 30 SEP 2021 30 SEP 2020 (UNAUDITED) CUMULATIVE QUARTER 1 JAN 2021 to 1 JAN 2020 to 30 SEP 2021 30 SEP 2020 Preceding Year Current Corresponding Financial Financial Period Period RM000 RM000 Current Quarter RM000 Preceding Year Changes Corresponding Increase/ Quarter (Decrease) RM000 RM000 Changes Increase (Decrease) RMODO 194.735 185,217 (111854) 73,363 (102,371) 92,364 (9.518) 9,483 (19,001) $84.442 (357,334) 227,108 423,564 (254,095) 169.469 160,878 103,219 57.639 4,353 (7,963) (4.036) 60 (3,375) 20,852 (25.436) (13,012) 4.589 (19.387) (12,717) Revenue Cost of sales Gross Profit Other income Administrative expenses Selling and marketing expenses Other expenses Finance costs Share of result of associates, net of tax Profit Inforetak Income tax expense Profit net of tax, representing total comprehensive income for the period 16.263 6,049 295 4320 (13.965) (4,677 (7.645) (600) 69,797 (19,985) 33 (6,002) (641) 60 (4.270) 600 (10.443) (1.186) 600 (11.629) (600) 129,725 198,627 68 902 (7,395) (3.120) BS (16,865) (54,596) (35,326) 19.270 45,537 49.812 (4.275) 144,031 94 399 49,632 Earnings per share (EPS) (in sen) Basic 5.74 29 20 1814 35.34 Diluted 432 18.84 13.65 35.71 CONDENSED CONSOLIDATED INCOME STATEMENT FOR THE THIRD QUARTER ENDED 30 SEPTEMBER 2021 (UNAUDITED) INDIVIDUAL QUARTER 1 JUL 2021 to 1 JUL 2020 to 30 SEP 2021 30 SEP 2020 Preceding Year Changes Current Corresponding Increase Quarter Quarter (Decrease) RNOOO RM000 RM000 (UNAUDITED) CUMULATIVE QUARTER 1 JAN 2021 to 1 JAN 2020 to 30 SEP 2021 30 SEP 2020 Preceding Year Current Corresponding Changes Financial Financial Increase Period Period (Decrease) RM000 RM1000 RM000 45,537 49,812 (4.275) 144,031 94.399 49.632 Profit for the period Total comprehensive income for the period 45.537 49.812 (4.275) 144,031 94,399 49.632 Total comprehensive income attribute to: Owner of the Company Non-controlling Interest 49.811 49,632 45,538 (0) 45.537 (4.273) (2) (4.275) 144,036 (5) 144.031 94,404 (5) 94.399 49.812 49.632 CONDENSED CONSOLIDATED STATEMENTS OF FINANCIAL POSITION AS AT 30 SEPTEMBER 2021 UNALDITED AS AT 30 SEP 2021 RM1000 AUDITED AS AT 31 DEC 2020 RM 1000 ASSETS Non-current assets Property, plant and equipment Investment properties Goodwill Other investment Inventories Other receivables 12,635 21.294 34,976 1,038 111.817 13.523 4,941 24,506 1,038 110.510 19,067 173.585 181.760 Current assets Inventories Contract assets Trade receivables Other receivables, deposits and prepaynents Deposits with licensed banks Cash and bank balances TOTAL ASSETS 385,079 227.528 261,074 73,774 63,386 114,002 1,124,843 1,306,603 361,434 177.474 203.346 32,294 26,494 187.786 988,828 1.162,413 EQUITY AND LIABILITIES Share capital Other reserves Retained earings Equity attributable to Owners of the Company Non-controlling interests TOTAL EQUITY 309,624 (7,620) SIO 308 812.312 29 812.341 220,520 5.864) 403.82 618,538 7,811 626,349 Non-current liabilities Borrowings Lease liabilities Deferred tax liabilities Other payable 175,651 3,062 1.524 180,687 2,655 2,236 13,800 199,386 180,237 Current liabilities Trade payables Other payables and accruals Contract liabilities Borrowings Lease liabilities Tax liabilities 148,839 88,330 4.175 30.345 1,651 40,685 314,025 494,262 1,306,603 182,715 81,698 3.797 41.528 1.310 25.630 336,67 536,064 1.162.413 TOTAL LIABILITIES TOTAL EQUITY AND LIABILITIES Net Assets per ordinary share (RM) 1.02 0.23