Calculate the following ratios for 2011,2012,2013
Return on assets
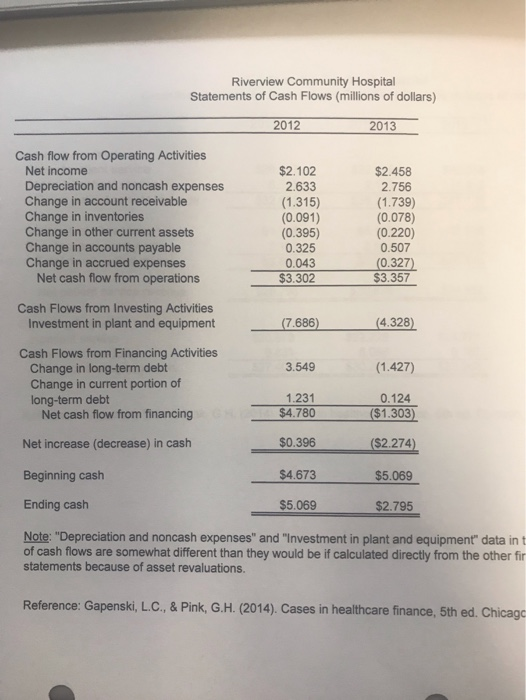
Days of cash on hand
Debt ratio
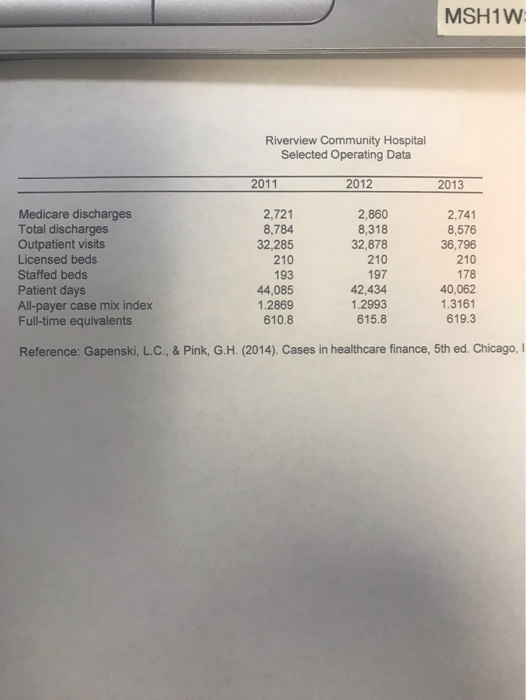
Days in Accounts receivable
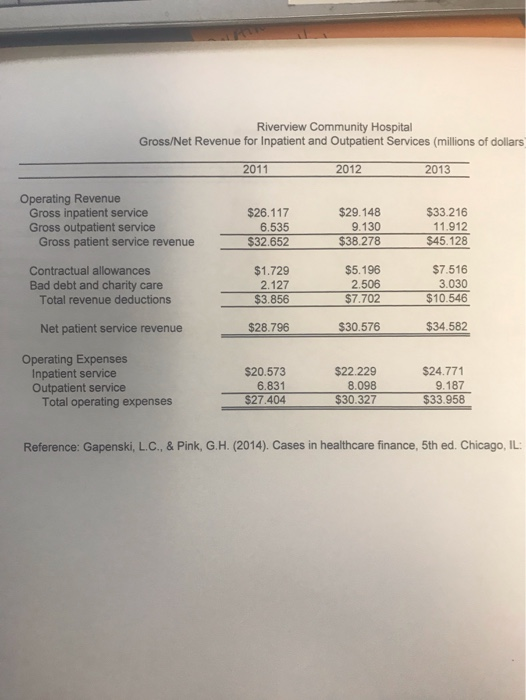
Cost per visit
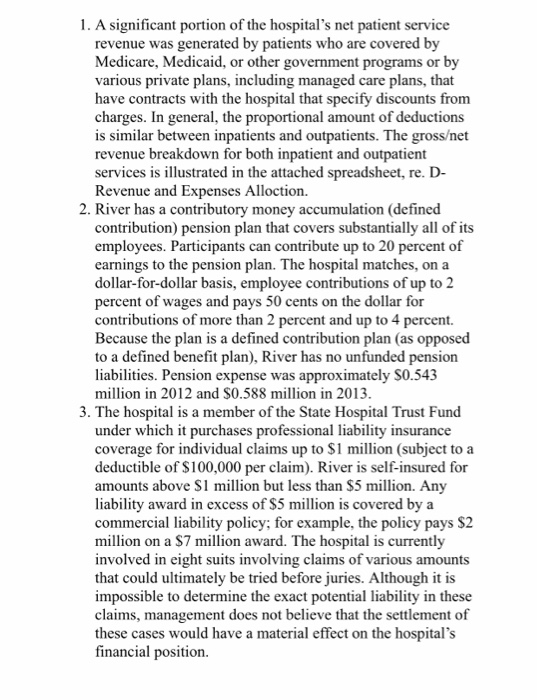
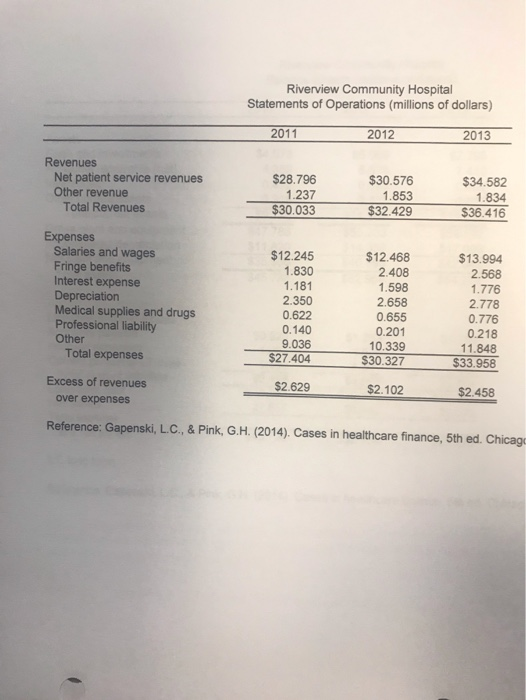
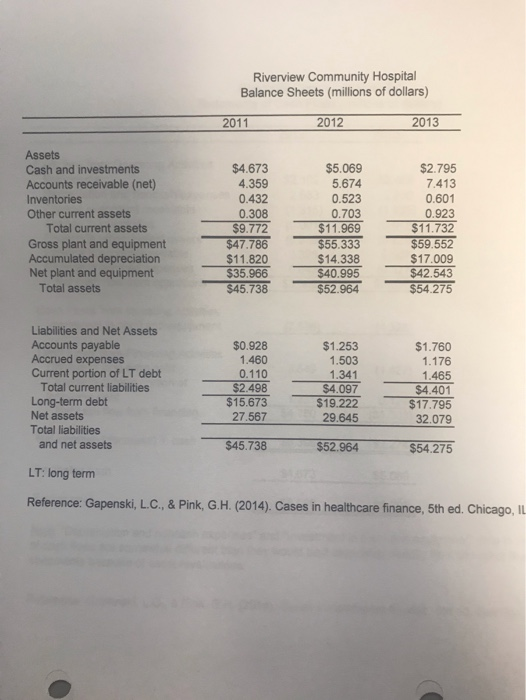
FINANCIAL CONDITION ANALYSIS Case study Riverview Community Hospital Riverview Community Hospital is a 210-bed, not-for-profit, acute care hospital with a long-standing reputation for providing quality healthcare services to a growing service area. Riverview competes with three other hospitals in its metropolitan statistical area (MSA) - two not-for-profit and one for-profit. It is the smallest of the four but has traditionally been ranked highest in patient satisfaction polls Hospitals are accredited by the Joint Commission, an independent not-for-profit organization whose mission is to improve the safety and quality of healthcare provided to the public through accreditation and related services. Although accreditation is optional for hospitals, it is generally required to qualify for governmental (Medicare and Medicaid) reimbursement, and hence the vast majority of hospitals apply for acereditation. River passed its latest Joint Commission survey with "flying colors" receiving the Gold Seal of Approval from that accrediting body In recent years, competition among the four hospitals in Riverview's service area has been keen but friendly. However, a large for-profit chain recently purchased the for-profit hospital, which has resulted in some anxiety among the managers of the other three hospitals because of the chain's reputation for aggressively increasing market share in the markets they serve. Relevant financial and operating data for Riverview Community Hospital are contained in the attached spreadsheets, re. A Statements of Operations, B-Balance Sheets, C-Statements of Cash Flows, D-Revenue and Expense Allocation, E. Selecting Operating Data and selected industry data are contained in F- Financial Ratios and G-Selected Industry Operating Ratios. In addition to the data in the spreadsheets, the following information was extracted from the notes section of Riverview's 2013 Annual Report 1. A significant portion of the hospital's net patient service revenue was generated by patients who are covered by Medicare, Medicaid, or other government programs or by various private plans, including managed care plans, that have contracts with the hospital that specify discounts from charges. In general, the proportional amount of deductions is similar between inpatients and outpatients. The grosset revenue breakdown for both inpatient and outpatient services is illustrated in the attached spreadsheet, re. D- Revenue and Expenses Alloction. 2. River has a contributory money accumulation (defined contribution) pension plan that covers substantially all of its employees. Participants can contribute up to 20 percent of earnings to the pension plan. The hospital matches, on a dollar-for-dollar basis, employee contributions of up to 2 percent of wages and pays 50 cents on the dollar for contributions of more than 2 percent and up to 4 percent. Because the plan is a defined contribution plan (as opposed to a defined benefit plan), River has no unfunded pension liabilities. Pension expense was approximately $0.543 million in 2012 and $0.588 million in 2013. 3. The hospital is a member of the State Hospital Trust Fund under which it purchases professional liability insurance coverage for individual claims up to $1 million (subject to a deductible of $100,000 per claim). River is self-insured for amounts above S1 million but less than $5 million. Any liability award in excess of $5 million is covered by a commercial liability policy; for example, the policy pays $2 million on a $7 million award. The hospital is currently involved in eight suits involving claims of various amounts that could ultimately be tried before juries. Although it is impossible to determine the exact potential liability in these claims, management does not believe that the settlement of these cases would have a material effect on the hospital's financial position Riverview Community Hospital Statements of Operations (millions of dollars) 2012 2011 2013 Revenues Net patient service revenues Other revenue Total Revenues $28.796 $30.576 $34.582 1.237 $30.033 1.853 1.834 $32.429 $36.416 Expenses Salaries and wages Fringe benefits Interest expense Depreciation Medical supplies and drugs Professional liability $12.245 $12.468 2.408 $13.994 1.830 2.568 1.776 2.778 0.776 1.181 1.598 2.350 2.658 0.622 0.655 0.140 0.201 0.218 Other 9.036 10.339 $30.327 11.848 Total expenses $27.404 $33.958 Excess of revenues $2.629 $2.102 $2.458 over expenses Reference: Gapenski, L.C., & Pink, G.H. (2014). Cases in healthcare finance, 5th ed. Chicage Riverview Community Hospital Balance Sheets (millions of dollars) 2012 2013 2011 Assets $5.069 $4.673 4,359 $2.795 7,413 Cash and investments Accounts receivable (net) Inventories Other current assets Total current assets 5.674 0.432 0.308 $9.772 $47.786 0.523 0.601 0.703 $11.969 $55.333 $14.338 $40.995 $52.964 0.923 $11.732 Gross plant and equipment Accumulated depreciation Net plant and equipment Total assets $59.552 $17.009 $42.543 $11.820 $35.966 $45.738 $54.275 Liabilities and Net Assets Accounts payable Accrued expenses Current portion of LT debt Total current liabilities Long-term debt Net assets $0.928 1,460 $1.253 $1.760 1.503 1.176 0.110 1,341 1.465 $4.097 $19.222 29.645 $2.498 $15.673 $4.401 $17.795 32.079 27.567 Total liabilities $45.738 and net assets $52.964 $54.275 LT: long term Reference: Gapenski, L.C., & Pink, G.H. (2014). Cases in healthcare finance, 5th ed. Chicago, IL Riverview Community Hospital Statements of Cash Flows (millions of dollars) 2012 2013 Cash flow from Operating Activities Net income $2.102 $2.458 2.756 Depreciation and noncash expenses Change in account receivable Change in inventories Change in other current assets Change in accounts payable Change in accrued expenses Net cash flow from operations 2.633 (1.315) (0.091) (0.395) 0.325 0.043 $3.302 (1.739) (0.078) (0.220) 0.507 (0.327) $3.357 Cash Flows from Investing Activities Investment in plant and equipment (4.328) (7.686) Cash Flows from Financing Activities Change in long-term debt Change in current portion of long-term debt Net cash flow from financing 3.549 (1.427) 1.231 0.124 ($1.303) $4.780 $0.396 Net increase (decrease) in cash ($2.274) Beginning cash $4.673 $5.069 Ending cash $5.069 $2.795 Note: "Depreciation and noncash expenses" and "Investment in plant and equipment" data in t of cash flows are somewhat different than they would be if calculated directly from the other fir statements because of asset revaluations. Reference: Gapenski, L.C., &Pink, G.H. (2014). Cases in healthcare finance, 5th ed. Chicag Riverview Community Hospital Gross/Net Revenue for Inpatient and Outpatient Services (millions of dollars 2012 2011 2013 Operating Revenue Gross inpatient service Gross outpatient service Gross patient service revenue $29.148 $33.216 $26.117 6.535 $32.652 9.130 11.912 $38.278 $45.128 $7.516 $5.196 Contractual allowances $1.729 2.127 3.030 Bad debt and charity care Total revenue deductions 2.506 $7.702 $10.546 $3.856 $30.576 $28.796 $34.582 Net patient service revenue Operating Expenses Inpatient service Outpatient service Total operating expenses $20.573 6.831 $24.771 $22.229 8.098 9.187 $27.404 $30.327 $33.958 Reference: Gapenski, L.C., & Pink, G.H. (2014). Cases in healthcare finance, 5th ed. Chicago, IL: MSH1W Riverview Community Hospital Selected Operating Data 2011 2012 2013 Medicare discharges Total discharges Outpatient visits Licensed beds Staffed beds Patient days All-payer case mix index Full-time equivalents 2,721 8,784 32,285 2,860 8,318 2,741 8,576 36,796 32,878 210 210 210 193 197 178 42,434 1.2993 40,062 44,085 1.3161 1.2869 615.8 619.3 610.8 Reference: Gapenski, L.C., & Pink, G.H. (2014). Cases in healthcare finance, 5th ed. Chicago