Answered step by step
Verified Expert Solution
Link Copied!

Question

1 Approved Answer

Calculate the following ratios for 2017 and 2018 from the income statements and statements of financial position provided above (ratio formulas included at the end
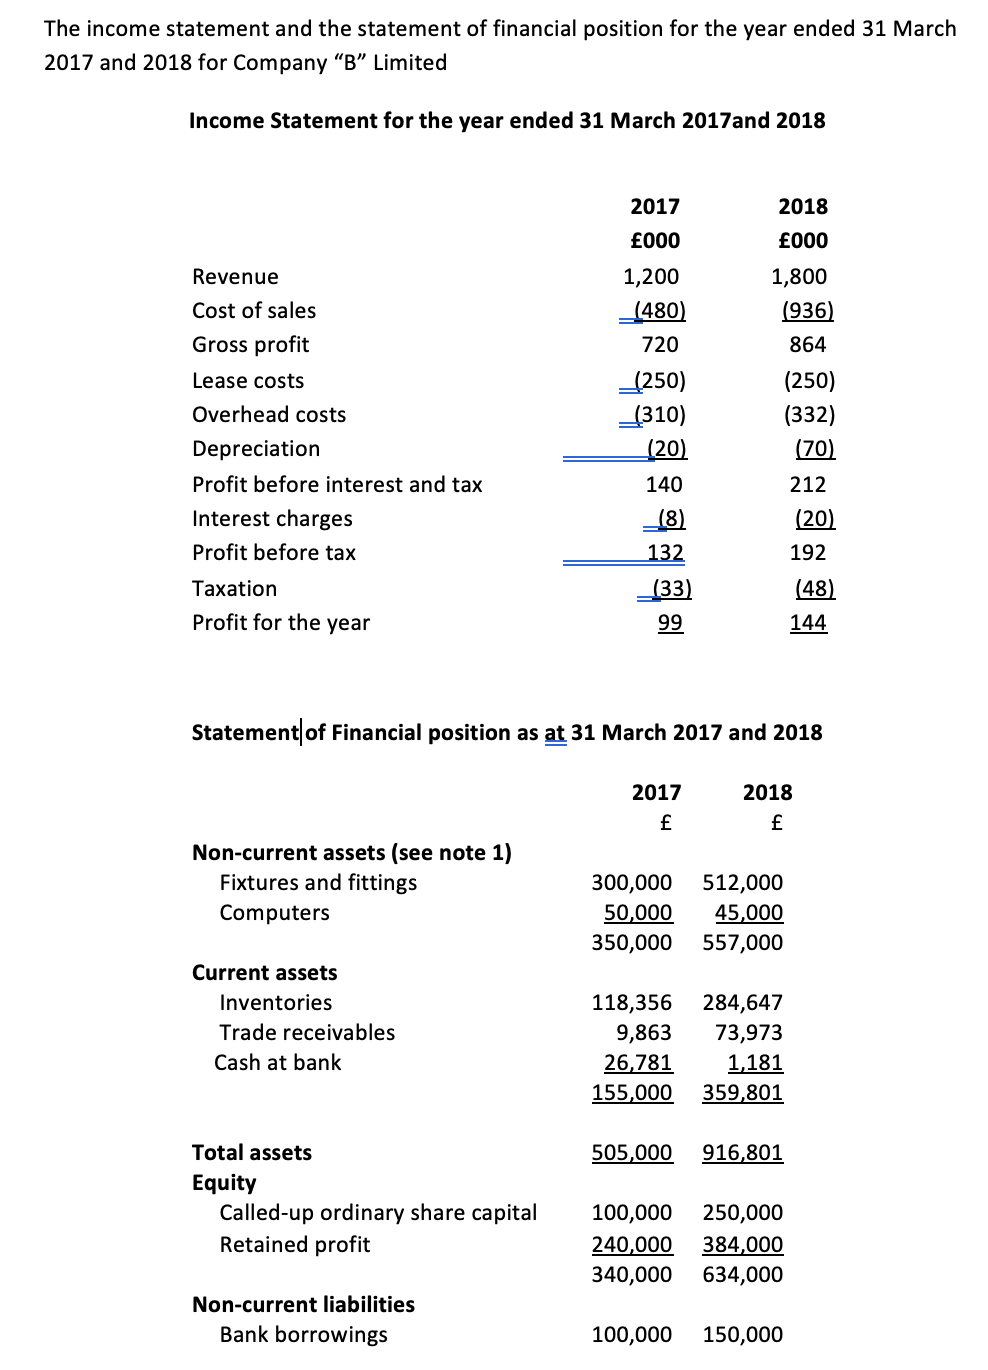
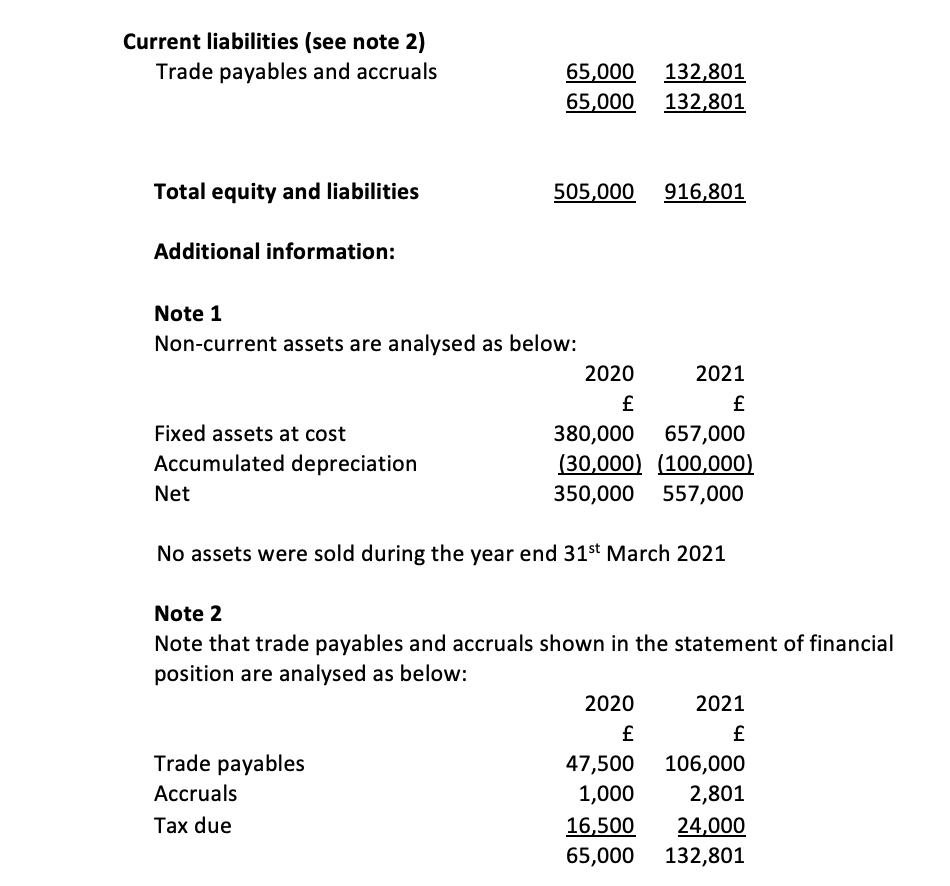
image text in transcribed

image text in transcribed

  1. Calculate the following ratios for 2017 and 2018 from the income statements and statements of financial position provided above (ratio formulas included at the end of the booklet).

  • Gross profit margin
  • Return on capital employed
  • Current ratio
  • Quick ratio
  • Gearing ratio
  • Interest cover ratio
  • Average inventories turnover period
  • Average settlement period for receivables
The income statement and the statement of financial position for the year ended 31 March 2017 and 2018 for Company B Limited Income Statement for the year ended 31 March 2017and 2018 2017 2018 000 000 Revenue Cost of sales Gross profit 1,800 (936) 864 Lease costs Overhead costs Depreciation Profit before interest and tax Interest charges Profit before tax 1,200 (480) 720 _(250) _1310) (20) 140 (8) 132 (250) (332) (70) 212 (20) 192 Taxation Profit for the year 133) (48) 144 99 Statement of Financial position as at 31 March 2017 and 2018 2017 2018 f Non-current assets (see note 1) Fixtures and fittings Computers 300,000 50,000 350,000 512,000 45,000 557,000 Current assets Inventories Trade receivables Cash at bank 118,356 9,863 26,781 155,000 284,647 73,973 1,181 359,801 505,000 916,801 Total assets Equity Called-up ordinary share capital Retained profit 100,000 240,000 340,000 250,000 384,000 634,000 Non-current liabilities Bank borrowings 100,000 150,000 Current liabilities (see note 2) Trade payables and accruals 65,000 132,801 65,000 132,801 Total equity and liabilities 505,000 916,801 Additional information: Note 1 Non-current assets are analysed as below: 2020 2021 f f Fixed assets at cost 380,000 657,000 Accumulated depreciation (30,000) (100,000) Net 350,000 557,000 No assets were sold during the year end 31st March 2021 Note 2 Note that trade payables and accruals shown in the statement of financial position are analysed as below: 2020 2021 Trade payables 47,500 106,000 Accruals 1,000 2,801 Tax due 16,500 24,000 65,000 132,801

Step by Step Solution

There are 3 Steps involved in it

Step: 1

blur-text-image

Get Instant Access to Expert-Tailored Solutions

See step-by-step solutions with expert insights and AI powered tools for academic success

Step: 2

blur-text-image

Step: 3

blur-text-image

Ace Your Homework with AI

Get the answers you need in no time with our AI-driven, step-by-step assistance

Get Started

Recommended Textbook for

Financial Accounting

Authors: LibbyShort

7th Edition

78111021, 978-0078111020

More Books

Students also viewed these Accounting questions

Question

LO14.1 Describe the characteristics of oligopoly.

Answered: 1 week ago