Answered step by step
Verified Expert Solution
Question
1 Approved Answer
Calculate the following ratios for JB Hi-Fi for the year ended 30 June 2020 based on the annual financial statements. Convert your figures to a
Calculate the following ratios for JB Hi-Fi for the year ended 30 June 2020 based on the annual financial statements. Convert your figures to a percentage (%) where specified. Round your answers to one decimal place (1 d.p.). You will need to record your numerator and denominator for each ratio in addition to your answer
Gross profit margin (%)
Operating profit margin (%)
Return on shareholders funds (%)
Inventory turnover in days
*Accounts receivable turnover in days
Current ratio
Acid test ratio
Interest cover ratio
Gearing ratio (%)
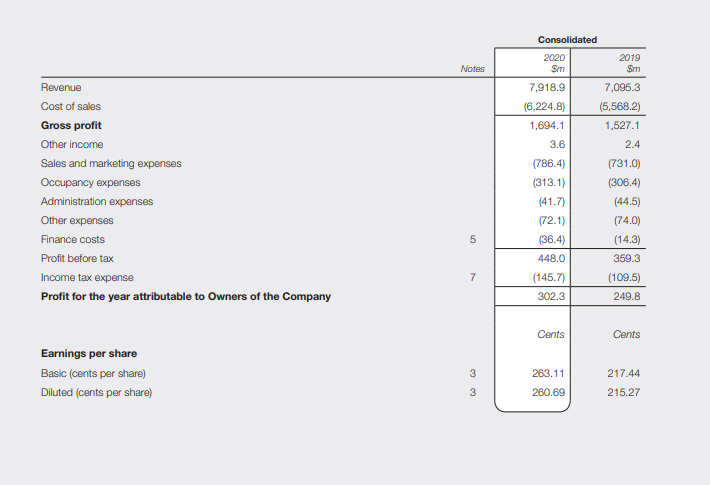
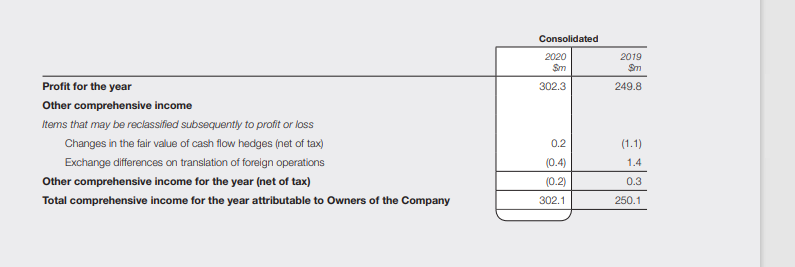
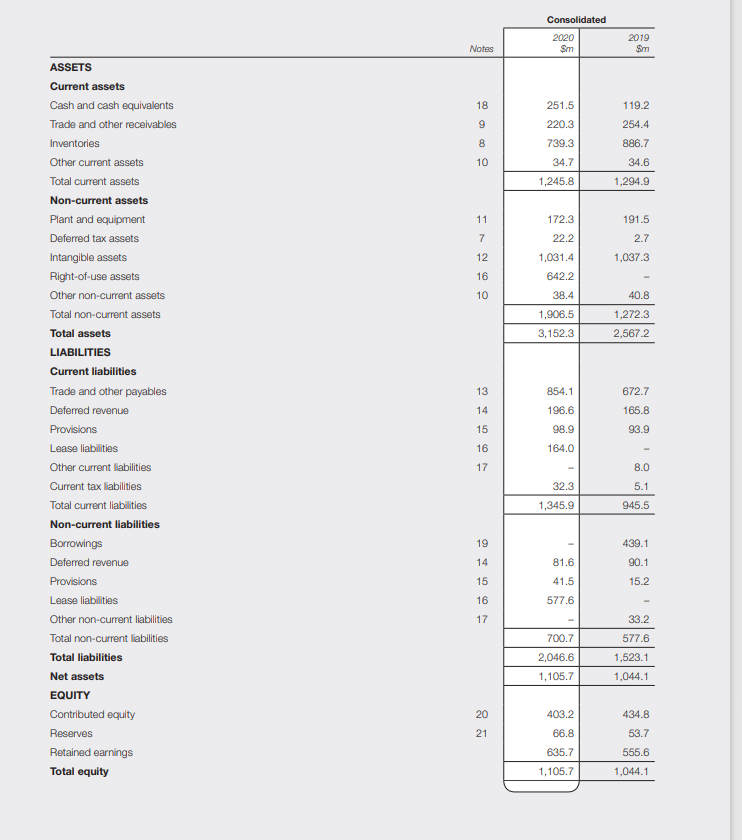
Consolidated 2020 Sm 2019 Sm Notes 7,095.3 Revenue Cost of sales Gross profit Other income Sales and marketing expenses Occupancy expenses Administration expenses Other expenses Finance costs Profit before tax Income tax expense Profit for the year attributable to Owners of the Company 7,918.9 (6,224.8) 1,694.1 3.6 (786.4) (313.1) (41.7) (72.1) (36.4) 448.0 (145.7) 302.3 (5,568.2) 1,527.1 2.4 (731.0) (306.4) (44.5) (74.0) (14.3) 359.3 (109.5) 249.8 5 7 Cents Cents Earnings per share Basic (cents per share) Diluted (cents per share) 3 263.11 217.44 215.27 3 260.69 Consolidated 2020 Sm 2019 $m 302.3 249.8 Profit for the year Other comprehensive income Items that may be reclassified subsequently to profit or loss Changes in the fair value of cash flow hedges (net of tax) Exchange differences on translation of foreign operations Other comprehensive income for the year (net of tax) Total comprehensive income for the year attributable to Owners of the Company 0.2 (1.1) 1.4 (0.4) (0.2) 0.3 302.1 250.1 Consolidated 2020 2019 Sm Notes 18 119.2 251.5 220.3 254.4 8 739.3 34.7 886.7 34.6 10 1,245.8 1,294.9 11 172.3 191.5 7 22.2 2.7 1,037.3 12 1,031.4 16 642.2 38.4 10 40.8 1,906.5 3,152.3 1,272.3 2,567.2 13 854.1 672.7 165.8 14 196.6 ASSETS Current assets Cash and cash equivalents Trade and other receivables Inventories Other current assets Total current assets Non-current assets Plant and equipment Deferred tax assets Intangible assets Right-of-use assets Other non-current assets Total non-current assets Total assets LIABILITIES Current liabilities Trade and other payables Deferred revenue Provisions Lease liabilities Other current liabilities Current tax liabilities Total current liabilities Non-current liabilities Borrowings Deferred revenue Provisions Lease liabilities Other non-current liabilities Total non-current liabilities Total liabilities Net assets EQUITY Contributed equity Reserves Retained earnings Total equity 15 93.9 98.9 164.0 16 17 8.0 32.3 5.1 1,345.9 945.5 19 439.1 14 81.6 90.1 15.2 15 41.5 16 577.6 17 33.2 577.6 700.7 2.046.6 1,523.1 1,105.7 1,044.1 20 21 403.2 66.8 434.8 53.7 635.7 555.6 1,105.7 1,044.1Step by Step Solution
There are 3 Steps involved in it
Step: 1
Get Instant Access to Expert-Tailored Solutions
See step-by-step solutions with expert insights and AI powered tools for academic success
Step: 2
Step: 3
Ace Your Homework with AI
Get the answers you need in no time with our AI-driven, step-by-step assistance
Get Started