Question
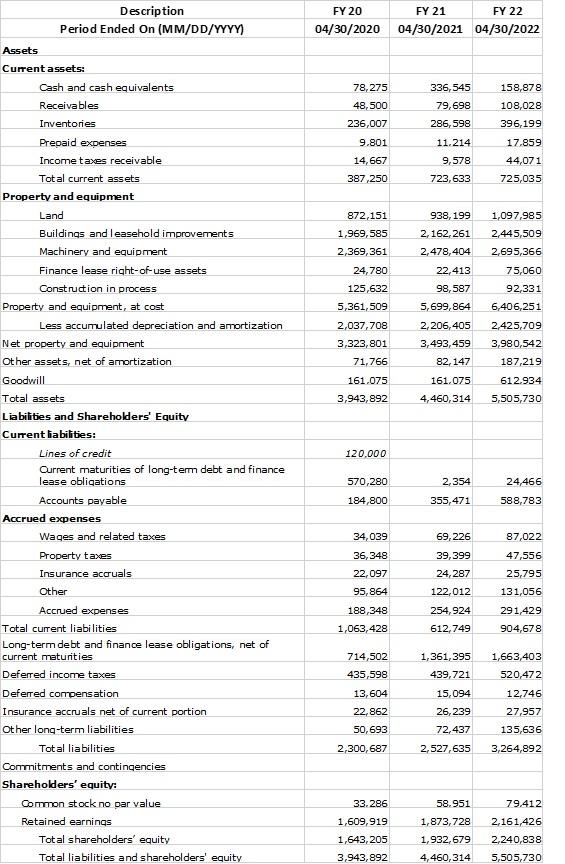
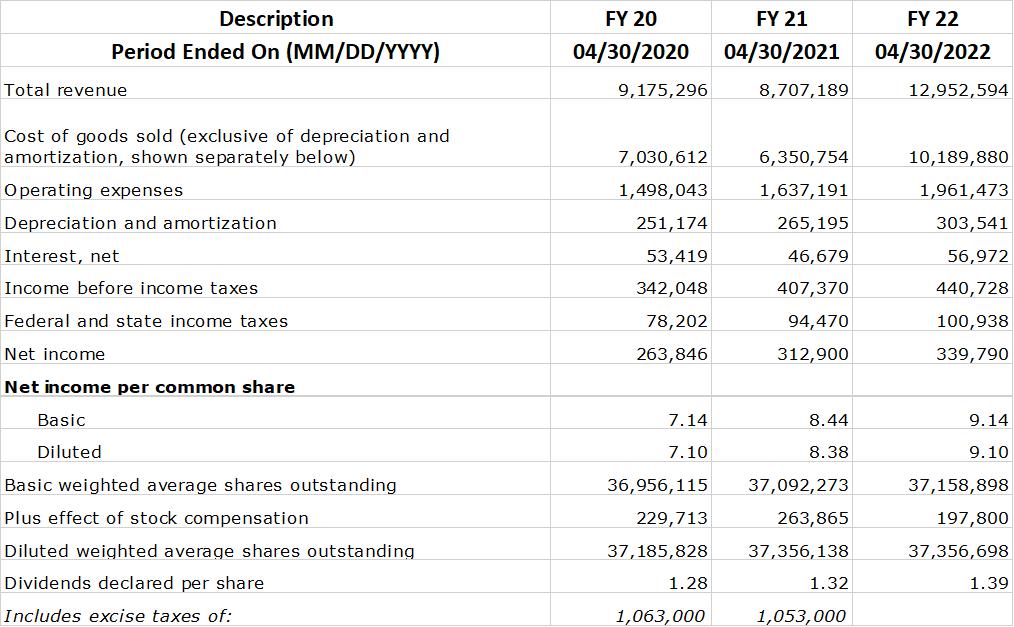
Calculate the following ratios for the year 2020 Liquidity: Current Ratio Quick Ratio Cash Ratio NWC NWC to Total Assets Interval Measure Leverage: Total Debt
Calculate the following ratios for the year 2020
Liquidity:
Current Ratio
Quick Ratio
Cash Ratio
NWC
NWC to Total Assets
Interval Measure
Leverage:
Total Debt Ratio
Debt/Equity
Equity Multiplier
Long-term debt ratio
Coverage Ratios:
Times Interest Earned
Cash Coverage
Receivable Ratios:
Receivables Turnover
Days’ Sales in Receivables
Asset Turnover:
Total Asset Turnover
It is not unusual for TAT < 1, especially if a firm has a large amount of fixed assets
NWC Turnover
Fixed Asset Turnover
Profitability Measures:
Profit Margin
Return on Assets (ROA)
Return on Equity (ROE)


Description Period Ended On (MM/DD/YYYY) Assets Current assets: Cash and cash equivalents Receivables Inventories Prepaid expenses Income taxes receivable Total current assets Property and equipment Land Buildings and leasehold improvements Machinery and equipment Finance lease right-of-use assets Construction in process Property and equipment, at cost Less accumulated depreciation and amortization Net property and equipment Other assets, net of amortization Goodwill Total assets Liabilities and Shareholders' Equity Current liabilities: Lines of credit Current maturities of long-term debt and finance lease obligations Accounts payable Accrued expenses Wages and related taxes Property taxes Insurance accruals Other Accrued expenses Total current liabilities Long-term debt and finance lease obligations, net of current maturities Deferred income taxes Deferred compensation Insurance accruals net of current portion Other long-term liabilities Total liabilities Commitments and contingencies Shareholders' equity: Common stock no par value Retained earnings Total shareholders' equity Total liabilities and shareholders' equity FY 20 04/30/2020 78,275 48,500 236,007 9.801 14,667 387,250 872,151 1,969,585 2,369,361 24,780 125,632 5,361,509 2,037,708 3,323,801 71,766 161.075 3,943,892 120,000 570,280 184,800 34,039 36,348 22,097 95,864 188,348 1,063,428 714,502 435,598 13,604 22,862 50,693 2,300,687 33.286 1,609,919 1,643,205 3,943,892 FY 21 04/30/2021 336,545 79,698 286, 598 11.214 9,578 723,633 938, 199 2,162,261 2,478,404 22,413 98,587 5,699,864 2,206,405 3,493,459 82,147 161.075 4,460,314 2,354 355,471 69,226 39,399 24,287 122,012 254,924 612,749 FY 22 04/30/2022 15,094 26,239 72,437 2,527,635 158,878 108,028 396,199 17.859 44,071 725,035 1,097,985 2,445,509 2,695,366 75,060 92,331 6,406,251 2,425,709 3,980,542 187,219 612.934 5,505,730 24,466 588,783 87,022 47,556 25,795 131,056 291,429 904,678 1,361,395 1,663,403 439,721 520,472 12,746 27,957 135,636 3,264,892 58.951 79.412 1,873,728 2,161,426 1,932,679 2,240,838 4,460,314 5,505,730
Step by Step Solution
3.50 Rating (160 Votes )
There are 3 Steps involved in it
Step: 1
SOLUTION To calculate the requested ratios well use the financial data provided Liquidity Ratios Current Ratio Current Assets Current Liabilities For 2020 Current Assets 387250 Current Liabilities 106...
Get Instant Access to Expert-Tailored Solutions
See step-by-step solutions with expert insights and AI powered tools for academic success
Step: 2

Step: 3

Ace Your Homework with AI
Get the answers you need in no time with our AI-driven, step-by-step assistance
Get Started


