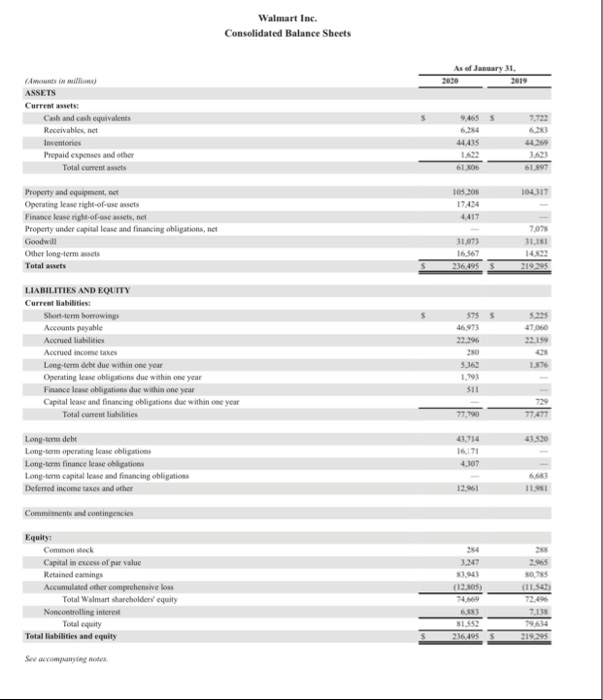
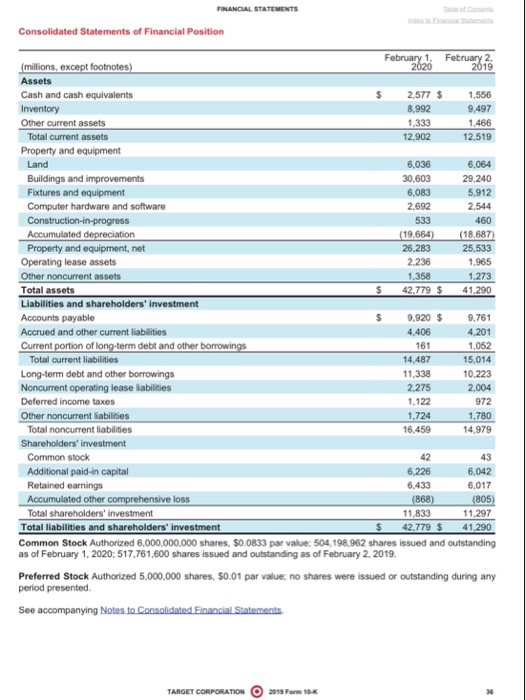
Calculate the following ratios for Walmart and a competitor for two years. Present your calculations in a table. Solvency ratios: 1. Debt-to-Equity Ratio = Total Liabilities : Stockholders' Equity Walmart Inc. Consolidated Balance Sheets As of January 31. Amount in millions) ASSETS Current assets Cash and cash equivalents Receivables, net Inventories Prepaid expenses and other Total current 9.4655 6,284 44.415 1A 61.806 6197 104317 105.203 17424 Property and equipment, not Operating lase right-of-use assets Finance lease right-of-use, net Property under capital lease and financing obligations, net Goodwill Other long-term its Total asets 7,078 31.073 16.567 1:42 219.295 LIABILITIES AND EQUITY Current liabilities Short-term borrowings Accounts payable Accrued liabilities Accrued income taxes Long-term debe due within one year Operating lease obligations due within one year Finance case obligations due within one year Capital lease and financing obligations due within one year Total current liabilities 5755 46.973 2295 20 5.225 470 22.159 1876 1.793 $11 77,790 77477 41.520 Long-term debet Long-term operating lease obligations Long-term finance lease obligations Long-term capital lease and financing obligations Deferred income taxes and other 43.714 16,171 4307 Commitments and contingencies 2015 0.75 Equity Commonsteck Capital in excess of par value Retained earnings Accumulated other comprehensive loss Total Walmart shareholders' equity Noncontrolling interest Total equity Total liabilities and equity 72.495 3943 (12.305) 74. 6,583 81.552 236,495 S 219.295 Se coming FINANCIAL STATEMENTS Consolidated Statements of Financial Position February 1, February 2 (millions, except footnotes) 2020 2019 Assets Cash and cash equivalents 2,577 $ 1.556 Inventory 8,992 9.497 Other current assets 1,333 1.466 Total current assets 12,902 12,519 Property and equipment Land 6,036 6,064 Buildings and improvements 30,603 29.240 Fixtures and equipment 6,083 5.912 Computer hardware and software 2.692 2.544 Construction-in-progress 533 460 Accumulated depreciation (19.664) (18.687) Property and equipment, net 26,283 25.533 Operating lease assets 2.236 1.965 Other noncurrent assets 1,358 1.273 Total assets $ 42.779 $ 41.290 Liabilities and shareholders' investment Accounts payable 9,920 $ 9.761 Accrued and other current liabilities 4,406 4.201 Current portion of long-term debt and other borrowings 1.052 Total current liabilities 14,487 15,014 Long-term debt and other borrowings 11,338 10.223 Noncurrent operating lease liabilities 2.275 2,004 Deferred income taxes 1.122 972 Other noncurrent liabilities 1.724 1.780 Total noncurrent liabilities 16,459 14.979 Shareholders' investment Common stock 42 Additional paid-in capital 6.226 6.042 Retained earnings 6.433 6.017 Accumulated other comprehensive loss (868) (805) Total shareholders' investment 11,833 11,297 Total liabilities and shareholders' investment 42.779 $ 41,290 Common Stock Authorized 6,000,000,000 shares. $0.0833 par value: 504.198,962 shares issued and outstanding as of February 1, 2020: 517.761,600 shares issued and outstanding as of February 2.2019. Preferred Stock Authorized 5,000,000 shares, $0.01 par value; no shares were issued or outstanding during any period presented See accompanying Notes to Consolidated Financial Statements 161 43 TARGET CORPORATION 2013 Form 10-K


