Answered step by step
Verified Expert Solution
Question
1 Approved Answer
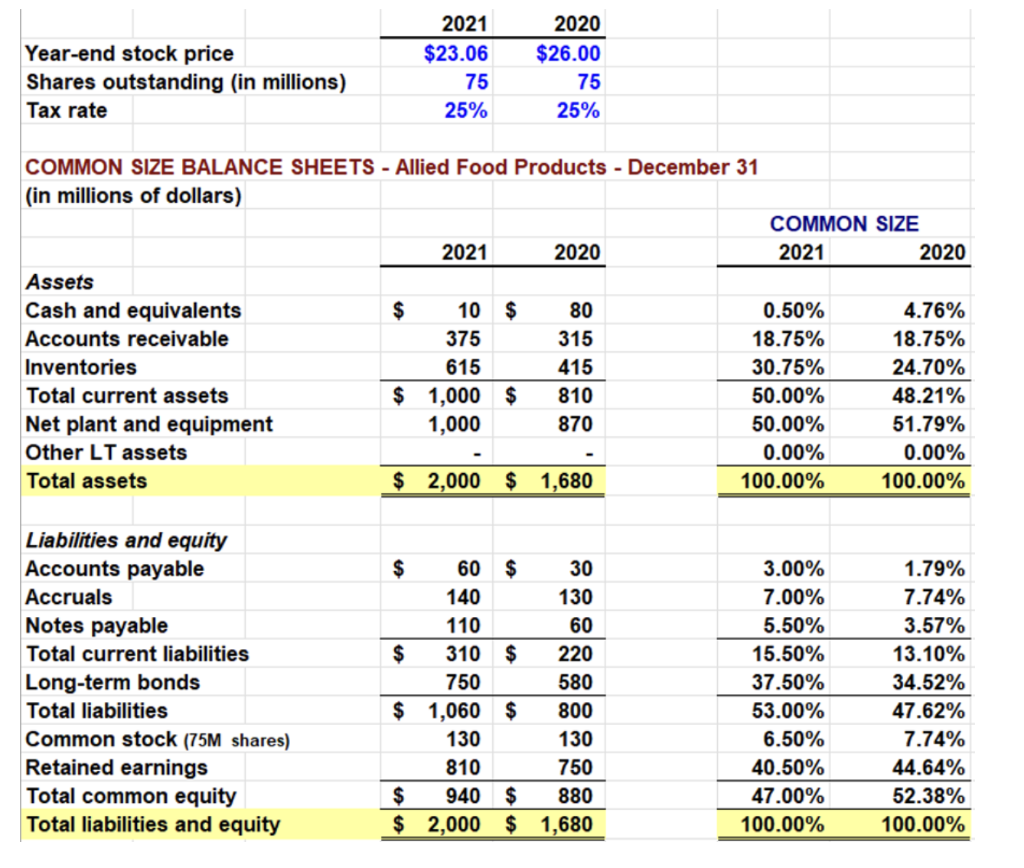
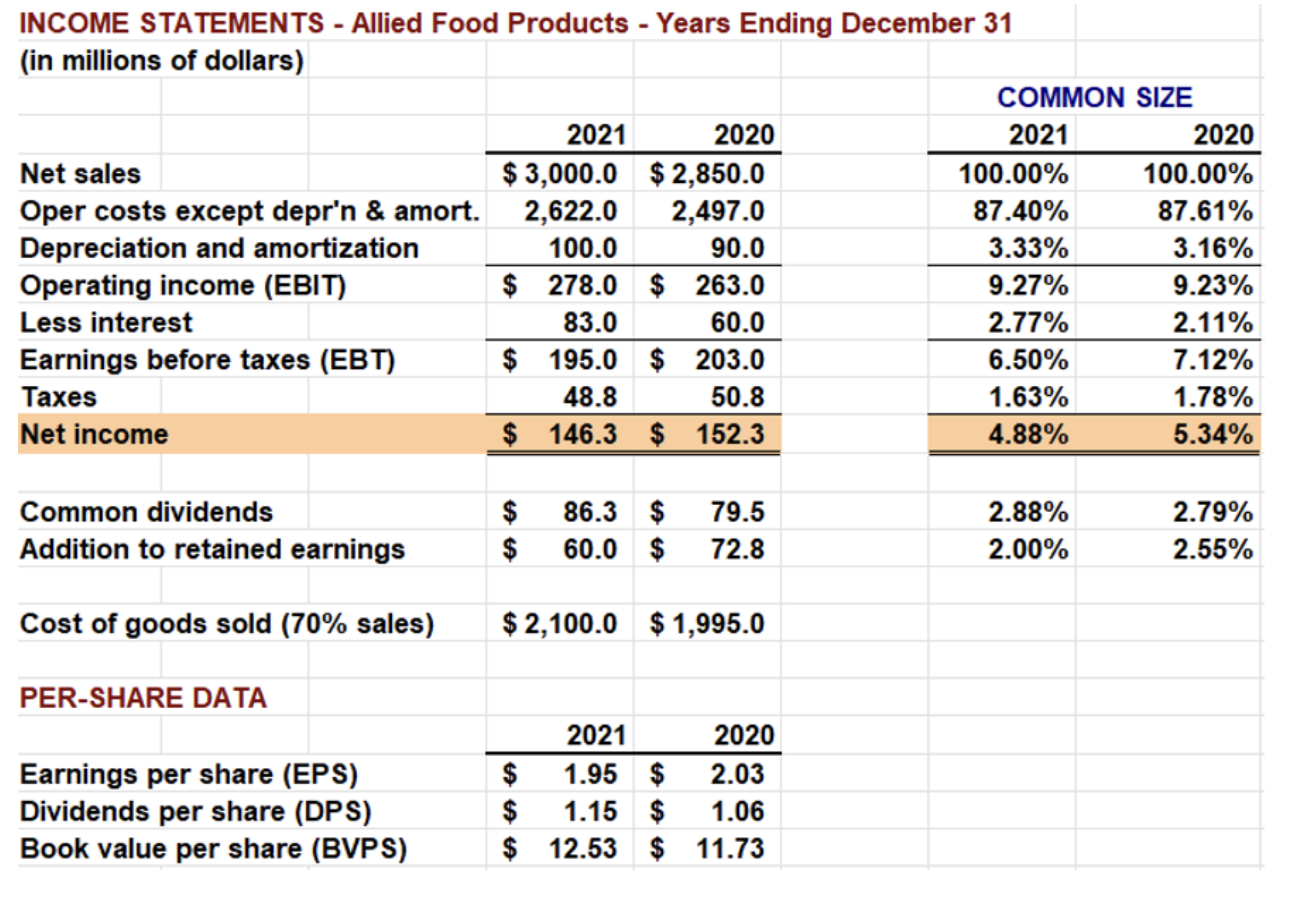
Calculate the following ratios for year 2021 only: Total debt to total capital = Times interest earned = Operating margin = Profit margin = Return


Calculate the following ratios for year 2021 only:
Total debt to total capital =
Times interest earned =
Operating margin =
Profit margin =
Return on total assets =
Return on common equity =
Return on invested capital =
Basic earning power =
Price to earning ratio =
Market to book ratio =
EV/EBITDA =
Year-end stock price Shares outstanding (in millions) Tax rate \begin{tabular}{r|r|} \hline 2021 & 2020 \\ \hline$23.06 & $26.00 \\ \hline 75 & 75 \\ 25% & 25% \\ \hline \end{tabular} COMMON SIZE BALANCE SHEETS - Allied Food Products - December 31 (in millions of dollars) Assets \begin{tabular}{rr|r|r|} & 2021 & & 2020 \\ \hline & & & \\ $ & 10 & $ & 80 \\ & 375 & & 315 \\ & 615 & & 415 \\ \hline$ & 1,000 & $ & 810 \\ & 1,000 & & 870 \\ & - & & - \\ \hline$ & 2,000 & $ & 1,680 \\ \hline \hline \end{tabular} \begin{tabular}{rr|} \hline \multicolumn{2}{|c|}{ COMMON SIZE } \\ \hline 2021 & 2020 \\ \hline & \\ \hline 0.50% & 4.76% \\ \hline 18.75% & 18.75% \\ \hline 30.75% & 24.70% \\ \hline 50.00% & 48.21% \\ \hline 50.00% & 51.79% \\ \hline 0.00% & 0.00% \\ \hline 100.00% & 100.00% \\ \hline \hline \end{tabular} Liabilities and equity Accounts payable Accruals Notes payable Total current liabilities Long-term bonds Total liabilities Common stock (75M shares) Retained earnings Total common equity Total liabilities and equity \begin{tabular}{|r|r|} \hline 3.00% & 1.79% \\ \hline 7.00% & 7.74% \\ \hline 5.50% & 3.57% \\ \hline 15.50% & 13.10% \\ \hline 37.50% & 34.52% \\ \hline 53.00% & 47.62% \\ \hline 6.50% & 7.74% \\ \hline 40.50% & 44.64% \\ \hline 47.00% & 52.38% \\ \hline 100.00% & 100.00% \\ \hline \hline \end{tabular} INCOME STATEMENTS - Allied Food Products - Years Ending December 31 (in millions of dollars) Net sales \begin{tabular}{rr} 2021 & 2020 \\ \hline$3,000.0 & $2,850.0 \end{tabular} Oper costs except depr'n \& amort. 2,622.02,497.0 Depreciation and amortization Operating income (EBIT) Less interest Earnings before taxes (EBT) Taxes \begin{tabular}{rr|} \hline 2021 & 2020 \\ \hline 100.00% & 100.00% \\ 87.40% & 87.61% \\ 3.33% & 3.16% \\ \hline 9.27% & 9.23% \\ \hline 2.77% & 2.11% \\ \hline 6.50% & 7.12% \\ \hline 1.63% & 1.78% \\ \hline 4.88% & 5.34% \\ \hline \hline \end{tabular} Common dividends \begin{tabular}{l|llll} Addition to retained earnings & $ & 60.0 & $ & 72.8 \end{tabular} \begin{tabular}{|l|l|} \hline 2.88% & 2.79% \\ \hline 2.00% & 2.55% \\ \hline \end{tabular} Cost of goods sold (70\% sales) $2,100.0$1,995.0 PER-SHARE DATA Earnings per share (EPS) Dividends per share (DPS) \begin{tabular}{rr|rr} & 2021 & & 2020 \\ \hline$ & 1.95 & $ & 2.03 \\ $ & 1.15 & $ & 1.06 \\ $ & 12.53 & $ & 11.73 \end{tabular} Year-end stock price Shares outstanding (in millions) Tax rate \begin{tabular}{r|r|} \hline 2021 & 2020 \\ \hline$23.06 & $26.00 \\ \hline 75 & 75 \\ 25% & 25% \\ \hline \end{tabular} COMMON SIZE BALANCE SHEETS - Allied Food Products - December 31 (in millions of dollars) Assets \begin{tabular}{rr|r|r|} & 2021 & & 2020 \\ \hline & & & \\ $ & 10 & $ & 80 \\ & 375 & & 315 \\ & 615 & & 415 \\ \hline$ & 1,000 & $ & 810 \\ & 1,000 & & 870 \\ & - & & - \\ \hline$ & 2,000 & $ & 1,680 \\ \hline \hline \end{tabular} \begin{tabular}{rr|} \hline \multicolumn{2}{|c|}{ COMMON SIZE } \\ \hline 2021 & 2020 \\ \hline & \\ \hline 0.50% & 4.76% \\ \hline 18.75% & 18.75% \\ \hline 30.75% & 24.70% \\ \hline 50.00% & 48.21% \\ \hline 50.00% & 51.79% \\ \hline 0.00% & 0.00% \\ \hline 100.00% & 100.00% \\ \hline \hline \end{tabular} Liabilities and equity Accounts payable Accruals Notes payable Total current liabilities Long-term bonds Total liabilities Common stock (75M shares) Retained earnings Total common equity Total liabilities and equity \begin{tabular}{|r|r|} \hline 3.00% & 1.79% \\ \hline 7.00% & 7.74% \\ \hline 5.50% & 3.57% \\ \hline 15.50% & 13.10% \\ \hline 37.50% & 34.52% \\ \hline 53.00% & 47.62% \\ \hline 6.50% & 7.74% \\ \hline 40.50% & 44.64% \\ \hline 47.00% & 52.38% \\ \hline 100.00% & 100.00% \\ \hline \hline \end{tabular} INCOME STATEMENTS - Allied Food Products - Years Ending December 31 (in millions of dollars) Net sales \begin{tabular}{rr} 2021 & 2020 \\ \hline$3,000.0 & $2,850.0 \end{tabular} Oper costs except depr'n \& amort. 2,622.02,497.0 Depreciation and amortization Operating income (EBIT) Less interest Earnings before taxes (EBT) Taxes \begin{tabular}{rr|} \hline 2021 & 2020 \\ \hline 100.00% & 100.00% \\ 87.40% & 87.61% \\ 3.33% & 3.16% \\ \hline 9.27% & 9.23% \\ \hline 2.77% & 2.11% \\ \hline 6.50% & 7.12% \\ \hline 1.63% & 1.78% \\ \hline 4.88% & 5.34% \\ \hline \hline \end{tabular} Common dividends \begin{tabular}{l|llll} Addition to retained earnings & $ & 60.0 & $ & 72.8 \end{tabular} \begin{tabular}{|l|l|} \hline 2.88% & 2.79% \\ \hline 2.00% & 2.55% \\ \hline \end{tabular} Cost of goods sold (70\% sales) $2,100.0$1,995.0 PER-SHARE DATA Earnings per share (EPS) Dividends per share (DPS) \begin{tabular}{rr|rr} & 2021 & & 2020 \\ \hline$ & 1.95 & $ & 2.03 \\ $ & 1.15 & $ & 1.06 \\ $ & 12.53 & $ & 11.73 \end{tabular}
Step by Step Solution
There are 3 Steps involved in it
Step: 1

Get Instant Access to Expert-Tailored Solutions
See step-by-step solutions with expert insights and AI powered tools for academic success
Step: 2

Step: 3

Ace Your Homework with AI
Get the answers you need in no time with our AI-driven, step-by-step assistance
Get Started


