Question
Calculate the following ratios for your company using the financial statements for the current year and prior year: - Current Ratio - Amount of Working
Calculate the following ratios for your company using the financial statements for the current year and prior year:
- Current Ratio
- Amount of Working Capital (Current Assets – Current Liabilities)
- Net Profit Margin
- Debt-to-Assets Ratio
SHOW ALL WORK and include an analysis for each calculation. (Example: Current Ratio is 2:1. This indicates the company has enough current assets to cover its current liabilities)
2.) For each of the ratios calculated in above part, calculate the percentage change from prior year. Have they improved or declined?
3.) Calculate the following ratios for your company using the financial statements (page number will be provided in email) for the current year only: - Fixed Asset Turnover - Return on Equity SHOW ALL WORK and include an analysis for each calculation (explained in Part 1).
4.) Are net cash flows from operating activities considered healthy or unhealthy in the current year? Why?
5.) Briefly skim the annual report provided to you (do not read the entire report – simply skim through the material) and state ONE interesting fact that you learned about the company from the annual report.
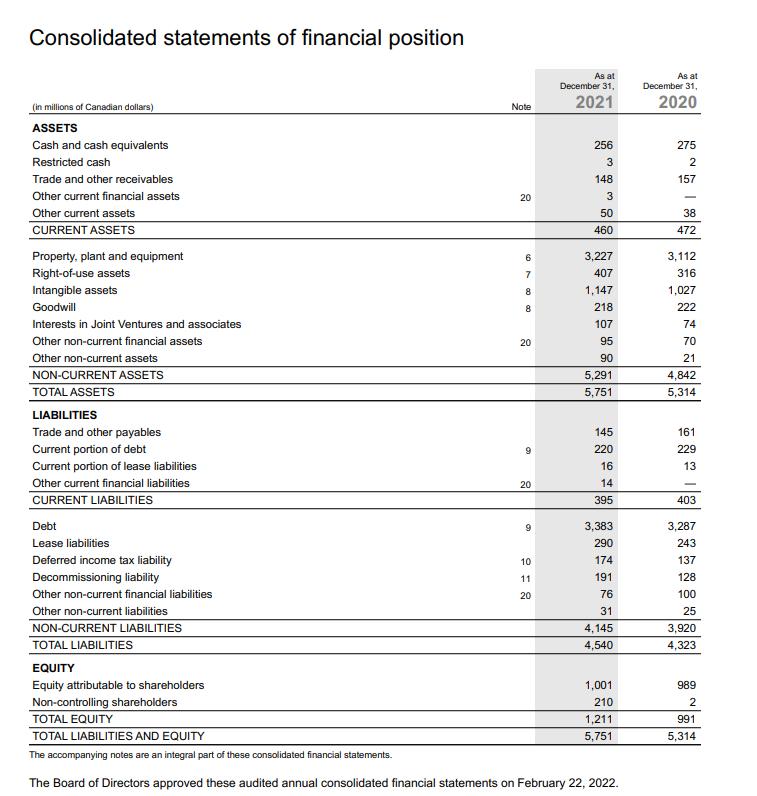
Consolidated statements of financial position (in millions of Canadian dollars) ASSETS Cash and cash equivalents Restricted cash Trade and other receivables Other current financial assets Other current assets CURRENT ASSETS Property, plant and equipment Right-of-use assets Intangible assets Goodwill Interests in Joint Ventures and associates Other non-current financial assets Other non-current assets NON-CURRENT ASSETS TOTAL ASSETS LIABILITIES Trade and other payables Current portion of debt Current portion of lease liabilities Other current financial liabilities CURRENT LIABILITIES Debt Lease liabilities Deferred income tax liability Decommissioning liability Other non-current financial liabilities Other non-current liabilities NON-CURRENT LIABILITIES TOTAL LIABILITIES EQUITY Equity attributable to shareholders Non-controlling shareholders Note 20 68880 7 20 9 20 6 10 11 20 As at December 31, 2021 256 3 148 3 50 460 3,227 407 1,147 218 107 95 90 5,291 5,751 145 220 16 14 395 3,383 290 174 191 76 31 4,145 4,540 1,001 210 1,211 5,751 TOTAL EQUITY TOTAL LIABILITIES AND EQUITY The accompanying notes are an integral part of these consolidated financial statements. The Board of Directors approved these audited annual consolidated financial statements on February 22, 2022. As at December 31, 2020 275 2 157 38 472 3,112 316 1,027 222 74 70 21 4,842 5,314 161 229 13 403 3,287 243 137 128 100 25 3,920 4,323 989 2 991 5,314
Step by Step Solution
3.40 Rating (150 Votes )
There are 3 Steps involved in it
Step: 1

Get Instant Access to Expert-Tailored Solutions
See step-by-step solutions with expert insights and AI powered tools for academic success
Step: 2

Step: 3

Ace Your Homework with AI
Get the answers you need in no time with our AI-driven, step-by-step assistance
Get Started


