

Answered step by step
Verified Expert Solution
Question
1 Approved Answer
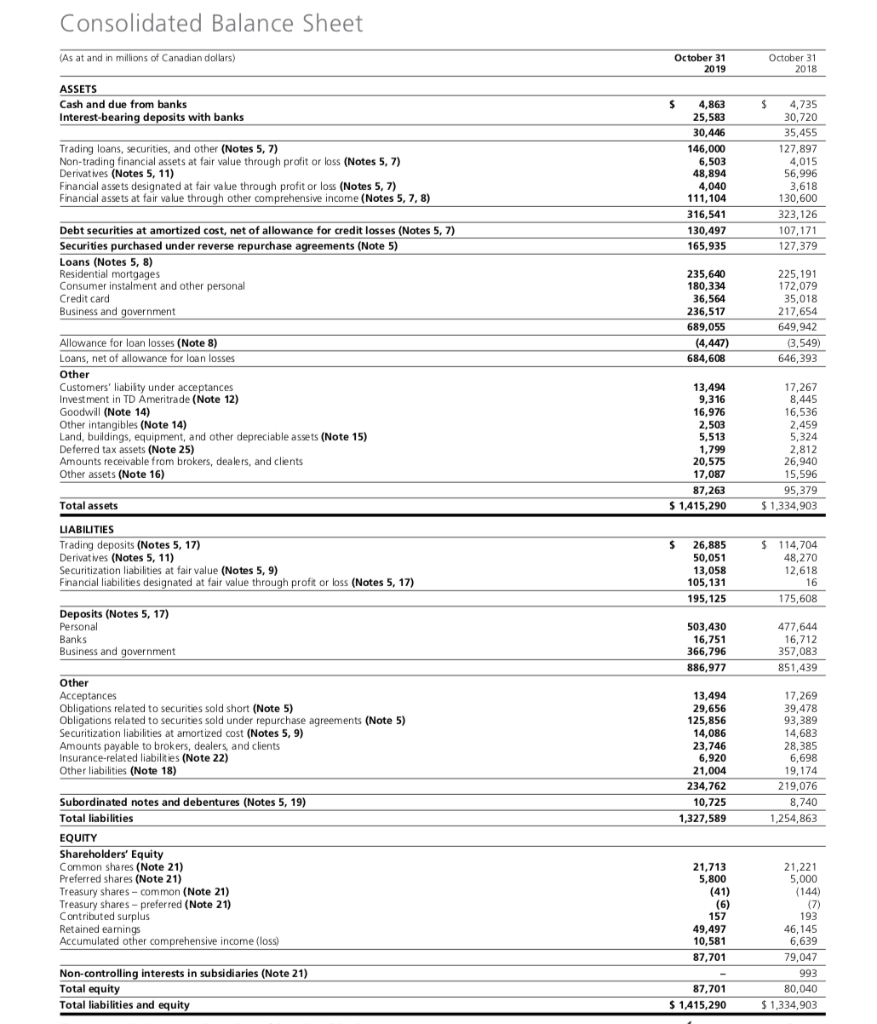
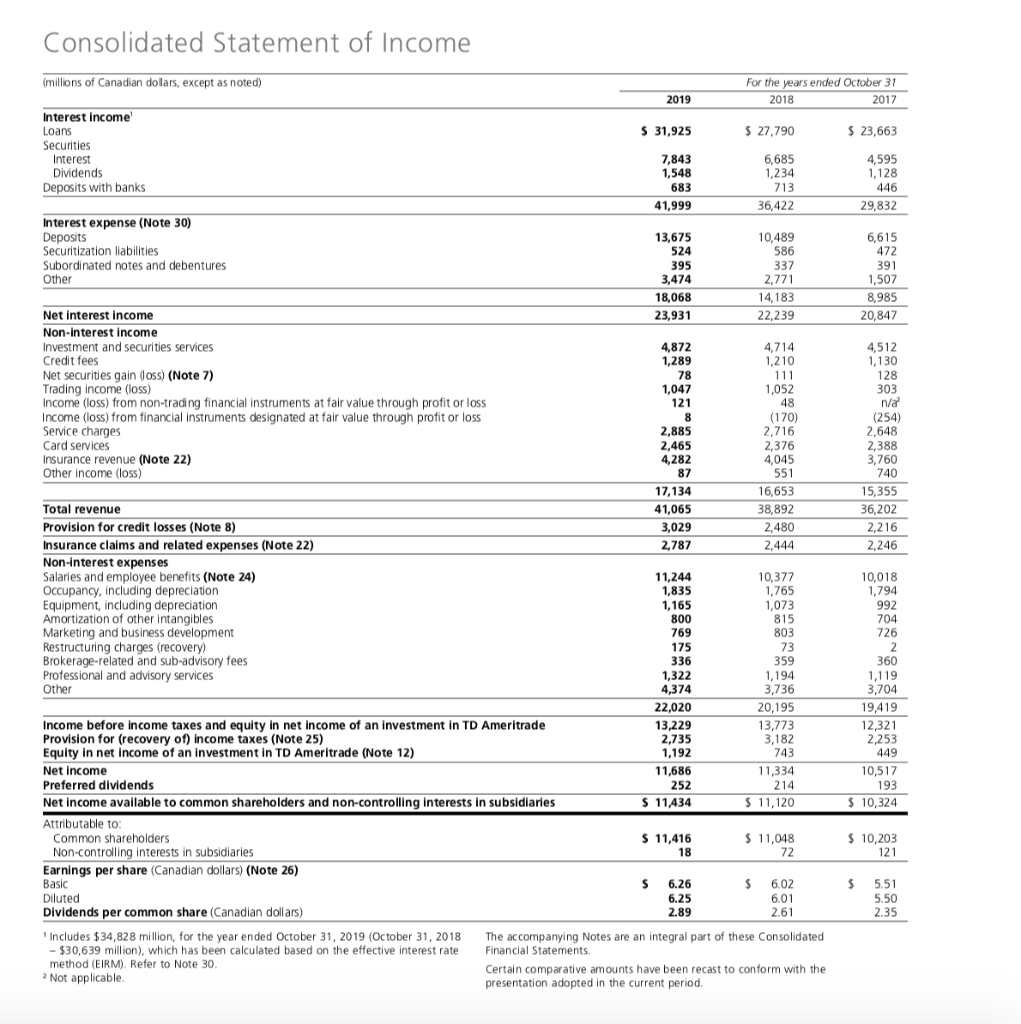
CALCULATE THE FOLLOWING RATIOS WITH FORMULAS : PROFIT MARGIN SPREAD NET INTEREST MARGIN LOAN LOSS PROVISION ASSET UTILIZATION Consolidated Balance Sheet (As at and in
 CALCULATE THE FOLLOWING RATIOS WITH FORMULAS :
PROFIT MARGIN
SPREAD
NET INTEREST MARGIN
LOAN LOSS PROVISION
ASSET UTILIZATION
Consolidated Balance Sheet (As at and in millions of Canadian dollars) October 31 2019 October 31 2018 ASSETS Cash and due from banks Interest-bearing deposits with banks $ $ Trading loans, securities, and other (Notes 5,7) Non-trading financial assets at fair value through profit or loss (Notes 5, 7) Derivatives (Notes 5, 11) Financial assets designated at fair value through profit or loss (Notes 5,7) Financial assets at fair value through other comprehensive income (Notes 5, 7, 8) 4,863 25,583 30,446 146,000 6,503 48,894 4,040 111,104 316,541 130,497 165,935 4,735 30,720 35,455 127,897 4,015 56,996 3,618 130,600 323,126 107,171 127,379 Debt securities at amortized cost, net of allowance for credit losses (Notes 5,7) Securities purchased under reverse repurchase agreements (Note 5) Loans (Notes 5, 8) Residential mortgages Consumer instalment and other personal Credit card Business and government 235,640 180,334 36,564 236,517 689,055 (4,447) 684,608 225,191 172,079 35,018 217,654 649,942 (3,549) 646,393 Allowance for loan losses (Note 8) Loans, net of allowance for loan losses Other Customers' liability under acceptances Investment in TD Ameritrade (Note 12) Goodwill (Note 14) Other intangibles (Note 14) Land, buildings, equipment, and other depreciable assets (Note 15) Deferred tax assets (Note 25) Amounts receivable from brokers, dealers, and clients Other assets (Note 16) 13,494 9,316 16,976 2,503 5,513 1,799 20,575 17,087 87,263 $ 1,415,290 17,267 8,445 16,536 2,459 5,324 2,812 26,940 15,596 95,379 $1,334,903 Total assets $ $ LIABILITIES Trading deposits (Notes 5, 17) Derivatives (Notes 5, 11) Securitization liabilities at fair value (Notes 5,9) Financial liabilities designated at fair value through profit or loss (Notes 5, 17) 26,885 50,051 13,058 105, 131 195, 125 114,704 48,270 12,618 16 175,608 Deposits (Notes 5, 17) Personal Banks Business and government 503,430 16,751 366,796 886,977 477,644 16,712 357,083 851,439 Other Acceptances Obligations related to securities sold short (Note 5) Obligations related to securities sold under repurchase agreements (Note 5) Securitization liabilities at amortized cost (Notes 5,9) Amounts payable to brokers, dealers, and clients Insurance-related liabilities (Note 22) Other liabilities (Note 18) 13,494 29,656 125,856 14,086 23,746 6.920 21,004 234,762 10,725 1,327,589 17,269 39,478 93,389 14,683 28,385 6,698 19, 174 219,076 8,740 1,254,863 Subordinated notes and debentures (Notes 5, 19) Total liabilities EQUITY Shareholders' Equity Common shares (Note 21) Preferred shares (Note 21) Treasury shares - common (Note 21) Treasury shares - preferred (Note 21) Contributed surplus Retained earnings Accumulated other comprehensive income (loss) 21,713 5,800 (41) (6) 157 49,497 10,581 87,701 - 21,221 5,000 (144) (7) 193 46,145 6,639 79,047 993 80,040 $1,334,903 Non-controlling interests in subsidiaries (Note 21) Total equity Total liabilities and equity 87,701 $ 1,415,290 Consolidated Statement of Income (millions of Canadian dollars, except as noted) For the years ended October 31 2018 2017 2019 $ 31,925 $ 27,790 $ 23,663 Interest income Loans Securities Interest Dividends Deposits with banks 4,595 7,843 1,548 683 41,999 6,685 1,234 713 36,422 1,128 446 29,832 Interest expense (Note 30) Deposits Securitization liabilities Subordinated notes and debentures Other 13,675 524 395 3,474 18,068 23,931 10,489 586 337 2,771 14,183 22,239 6,615 472 391 1,507 8,985 20,847 4,872 1,289 78 Net interest income Non-interest income Investment and securities services Credit fees Net securities gain (oss) (Note 7) Trading income (los) Income (loss) from non-trading financial instruments at fair value through profit or loss Income (loss) from financial instruments designated at fair value through profit or loss Service charges Card services Insurance revenue (Note 22) Other income (los) 1,047 121 2,885 2,465 4,282 87 17,134 41,065 3,029 2,787 4,714 1,210 111 1,052 48 (170) 2,716 2,376 4,045 551 16,653 38,892 2,480 2,444 4,512 1,130 128 303 n/a (254) 2,648 2,388 3,760 740 15,355 36,202 2,216 2,246 Total revenue Provision for credit losses (Note 8) Insurance claims and related expenses (Note 22) Non-interest expenses Salaries and employee benefits (Note 24) Occupancy, including depreciation Equipment, including depreciation Amortization of other intangibles Marketing and business development Restructuring charges (recovery) Brokerage-related and sub-advisory fees Professional and advisory services Other 10,377 1,765 1,073 815 803 10,018 1,794 992 704 726 73 11,244 1,835 1,165 800 769 175 336 1,322 4,374 22,020 13,229 2,735 1,192 11,686 252 $ 11,434 Income before income taxes and equity in net income of an investment in TD Ameritrade Provision for (recovery of) income taxes (Note 25) Equity in net income of an investment in TD Ameritrade (Note 12) Net income Preferred dividends Net Income available to common shareholders and non-controlling interests in subsidiaries 359 1,194 3,736 20,195 13,773 3,182 743 11,334 214 $ 11,120 360 1,119 3,704 19,419 12,321 2,253 449 10,517 193 $ 10,324 $ 11,416 $ 11,048 72 $ 10,203 18 S $ $ Attributable to: Common shareholders Non-controlling interests in subsidiaries Earnings per share (Canadian dollars) (Note 26) Basic Diluted Dividends per common share (Canadian dollars) Includes $34,828 million for the year ended October 31, 2019 (October 31, 2018 -$30,639 million), which has been calculated based on the effective interest rate method (EIRM). Refer to Note 30. 2 Not applicable. 6.26 6.25 6.02 6.01 5.51 5.50 2.89 261 The accompanying Notes are an integral part of these Consolidated Financial Statements Certain comparative amounts have been recast to conform with the presentation adopted in the current period. Consolidated Balance Sheet (As at and in millions of Canadian dollars) October 31 2019 October 31 2018 ASSETS Cash and due from banks Interest-bearing deposits with banks $ $ Trading loans, securities, and other (Notes 5,7) Non-trading financial assets at fair value through profit or loss (Notes 5, 7) Derivatives (Notes 5, 11) Financial assets designated at fair value through profit or loss (Notes 5,7) Financial assets at fair value through other comprehensive income (Notes 5, 7, 8) 4,863 25,583 30,446 146,000 6,503 48,894 4,040 111,104 316,541 130,497 165,935 4,735 30,720 35,455 127,897 4,015 56,996 3,618 130,600 323,126 107,171 127,379 Debt securities at amortized cost, net of allowance for credit losses (Notes 5,7) Securities purchased under reverse repurchase agreements (Note 5) Loans (Notes 5, 8) Residential mortgages Consumer instalment and other personal Credit card Business and government 235,640 180,334 36,564 236,517 689,055 (4,447) 684,608 225,191 172,079 35,018 217,654 649,942 (3,549) 646,393 Allowance for loan losses (Note 8) Loans, net of allowance for loan losses Other Customers' liability under acceptances Investment in TD Ameritrade (Note 12) Goodwill (Note 14) Other intangibles (Note 14) Land, buildings, equipment, and other depreciable assets (Note 15) Deferred tax assets (Note 25) Amounts receivable from brokers, dealers, and clients Other assets (Note 16) 13,494 9,316 16,976 2,503 5,513 1,799 20,575 17,087 87,263 $ 1,415,290 17,267 8,445 16,536 2,459 5,324 2,812 26,940 15,596 95,379 $1,334,903 Total assets $ $ LIABILITIES Trading deposits (Notes 5, 17) Derivatives (Notes 5, 11) Securitization liabilities at fair value (Notes 5,9) Financial liabilities designated at fair value through profit or loss (Notes 5, 17) 26,885 50,051 13,058 105, 131 195, 125 114,704 48,270 12,618 16 175,608 Deposits (Notes 5, 17) Personal Banks Business and government 503,430 16,751 366,796 886,977 477,644 16,712 357,083 851,439 Other Acceptances Obligations related to securities sold short (Note 5) Obligations related to securities sold under repurchase agreements (Note 5) Securitization liabilities at amortized cost (Notes 5,9) Amounts payable to brokers, dealers, and clients Insurance-related liabilities (Note 22) Other liabilities (Note 18) 13,494 29,656 125,856 14,086 23,746 6.920 21,004 234,762 10,725 1,327,589 17,269 39,478 93,389 14,683 28,385 6,698 19, 174 219,076 8,740 1,254,863 Subordinated notes and debentures (Notes 5, 19) Total liabilities EQUITY Shareholders' Equity Common shares (Note 21) Preferred shares (Note 21) Treasury shares - common (Note 21) Treasury shares - preferred (Note 21) Contributed surplus Retained earnings Accumulated other comprehensive income (loss) 21,713 5,800 (41) (6) 157 49,497 10,581 87,701 - 21,221 5,000 (144) (7) 193 46,145 6,639 79,047 993 80,040 $1,334,903 Non-controlling interests in subsidiaries (Note 21) Total equity Total liabilities and equity 87,701 $ 1,415,290 Consolidated Statement of Income (millions of Canadian dollars, except as noted) For the years ended October 31 2018 2017 2019 $ 31,925 $ 27,790 $ 23,663 Interest income Loans Securities Interest Dividends Deposits with banks 4,595 7,843 1,548 683 41,999 6,685 1,234 713 36,422 1,128 446 29,832 Interest expense (Note 30) Deposits Securitization liabilities Subordinated notes and debentures Other 13,675 524 395 3,474 18,068 23,931 10,489 586 337 2,771 14,183 22,239 6,615 472 391 1,507 8,985 20,847 4,872 1,289 78 Net interest income Non-interest income Investment and securities services Credit fees Net securities gain (oss) (Note 7) Trading income (los) Income (loss) from non-trading financial instruments at fair value through profit or loss Income (loss) from financial instruments designated at fair value through profit or loss Service charges Card services Insurance revenue (Note 22) Other income (los) 1,047 121 2,885 2,465 4,282 87 17,134 41,065 3,029 2,787 4,714 1,210 111 1,052 48 (170) 2,716 2,376 4,045 551 16,653 38,892 2,480 2,444 4,512 1,130 128 303 n/a (254) 2,648 2,388 3,760 740 15,355 36,202 2,216 2,246 Total revenue Provision for credit losses (Note 8) Insurance claims and related expenses (Note 22) Non-interest expenses Salaries and employee benefits (Note 24) Occupancy, including depreciation Equipment, including depreciation Amortization of other intangibles Marketing and business development Restructuring charges (recovery) Brokerage-related and sub-advisory fees Professional and advisory services Other 10,377 1,765 1,073 815 803 10,018 1,794 992 704 726 73 11,244 1,835 1,165 800 769 175 336 1,322 4,374 22,020 13,229 2,735 1,192 11,686 252 $ 11,434 Income before income taxes and equity in net income of an investment in TD Ameritrade Provision for (recovery of) income taxes (Note 25) Equity in net income of an investment in TD Ameritrade (Note 12) Net income Preferred dividends Net Income available to common shareholders and non-controlling interests in subsidiaries 359 1,194 3,736 20,195 13,773 3,182 743 11,334 214 $ 11,120 360 1,119 3,704 19,419 12,321 2,253 449 10,517 193 $ 10,324 $ 11,416 $ 11,048 72 $ 10,203 18 S $ $ Attributable to: Common shareholders Non-controlling interests in subsidiaries Earnings per share (Canadian dollars) (Note 26) Basic Diluted Dividends per common share (Canadian dollars) Includes $34,828 million for the year ended October 31, 2019 (October 31, 2018 -$30,639 million), which has been calculated based on the effective interest rate method (EIRM). Refer to Note 30. 2 Not applicable. 6.26 6.25 6.02 6.01 5.51 5.50 2.89 261 The accompanying Notes are an integral part of these Consolidated Financial Statements Certain comparative amounts have been recast to conform with the presentation adopted in the current periodStep by Step Solution
There are 3 Steps involved in it
Step: 1

Get Instant Access to Expert-Tailored Solutions
See step-by-step solutions with expert insights and AI powered tools for academic success
Step: 2

Step: 3
Ace Your Homework with AI
Get the answers you need in no time with our AI-driven, step-by-step assistance
Get Started
Financial Accounting A User Perspective
Authors: Robert E. Hoskin, Maureen R. Fizzell, Donald C. Cherry
4th Canadian Edition
0470834455, 978-0470834459