Calculate the intrinsic value of Rio Tinto shares using the free cash flow model of Spreadsheet 18.2. Treat each scenario independently. 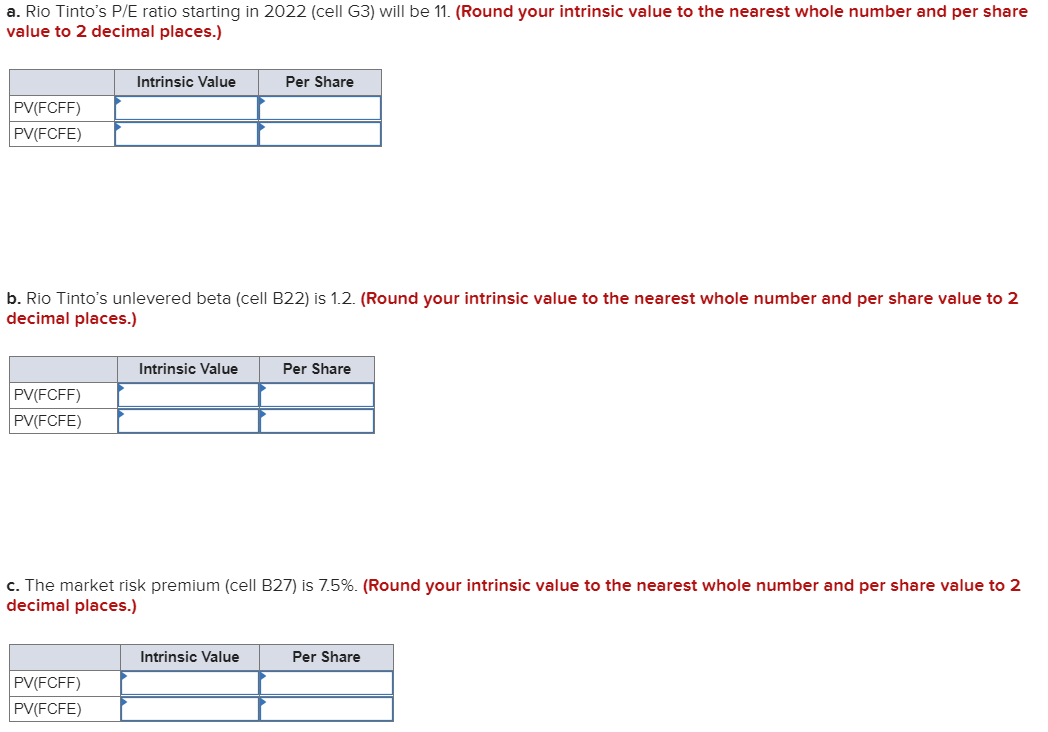
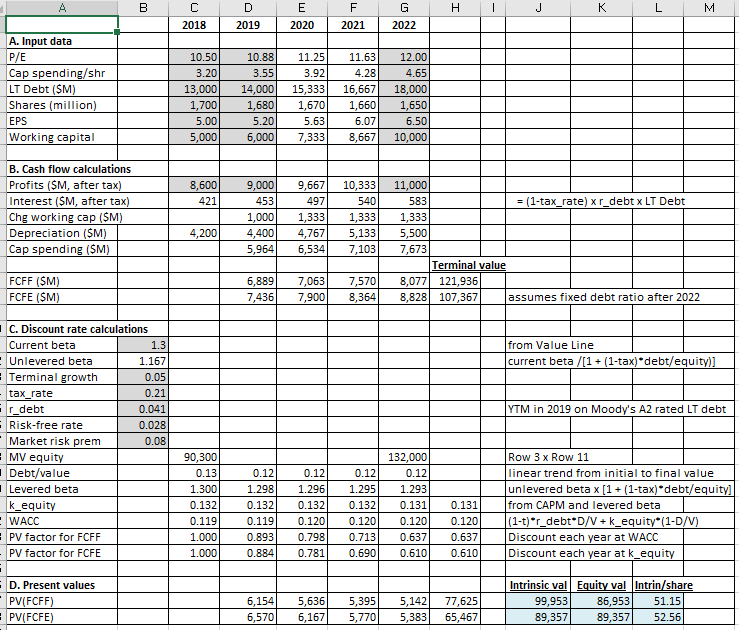
a. Rio Tinto's P/E ratio starting in 2022 (cell G3) will be 11. (Round your intrinsic value to the nearest whole number and per share value to 2 decimal places.) Intrinsic Value Per Share PV(FCFF) PV(FCFE) b. Rio Tinto's unlevered beta (cell B22) is 1.2. (Round your intrinsic value to the nearest whole number and per share value to 2 decimal places.) Intrinsic Value Per Share PV(FCFF) PV(FCFE) c. The market risk premium (cell B27) is 7.5%. (Round your intrinsic value to the nearest whole number and per share value to 2 decimal places.) Intrinsic Value Per Share PV(FCFF) PV(FCFE) A B C D E I I H. 1 J K M 8 G 2022 L 2018 2019 2020 2021 A. Input data P/E Cap spending/shr LT Debt ($M) Shares (million) EPS Working capital 10.50 3.20 13,000 1,700 5.00 5,000 10.88 3.55 14,000 1,680 5.201 6,000 11.25 3.92 15,333 1,670 5.63 7,333 11.63 4.28 16,667 1,660 6.07 8,667 12.00 4.65 18,000 1,650 6.50 10,000 8,600 421 B. Cash flow calculations Profits (SM, after tax) Interest ($M, after tax) Chg working cap ($M) Depreciation ($M) Cap spending ($M) 9,000 453 1,000 4,400 5,964 9,667 497 1,333 4,767 6,534 10,333 540 1,333 5,133 7,103 4,200 11,000 583 = (1-tax_rate) xr_debt x LT Debt 1,333 5,500 7,673 Terminal value 8,077 121,936 8,828 107,367 assumes fixed debt ratio after 2022 FCFF (SM) FCFE (SM) 6,889 7,436 7,063 7,900 7,570 8,364 from Value Line current beta /(1 + (1-tax)*debt/equity)] YTM in 2019 on Moody's A2 rated LT debt I C. Discount rate calculations Current beta 1.3 Unlevered beta 1.167 - Terminal growth 0.05 tax_rate 0.21 r_debt 0.041 - Risk-free rate 0.028 Market risk prem 0.08 MV equity Debt/value Levered beta k_equity WACC PV factor for FCFF PV factor for FCFE 90,300 0.13 1.300 0.132 0.119 1.000 1.000 0.12 1.298 0.132 0.119 0.893 0.884 0.12 1.296 0.132 0.120 0.798 0.781 0.12 1.295 0.132 0.120 0.713 0.690 132,000 0.12) 1.293 0.131 0.120 0.637 0.610 0.131 0.120 0.637 0.610 Row 3 x Row 11 linear trend from initial to final value unlevered beta x (1 + (1-tax)*debt/equity] from CAPM and levered beta (1-t)*r_debtD/V + k_equity*(1-D/V) Discount each year at WACC Discount each year at k_equity D. Present values PV(FCFF) PV(FCFE) 6,154 6,570 5,636 6,167 5,395 5,770 5,142 5,383 77,625 65,467 Intrinsic val Equity val Intrin/share 99,953 86,953 51.15 89,357 89,357 52.56 a. Rio Tinto's P/E ratio starting in 2022 (cell G3) will be 11. (Round your intrinsic value to the nearest whole number and per share value to 2 decimal places.) Intrinsic Value Per Share PV(FCFF) PV(FCFE) b. Rio Tinto's unlevered beta (cell B22) is 1.2. (Round your intrinsic value to the nearest whole number and per share value to 2 decimal places.) Intrinsic Value Per Share PV(FCFF) PV(FCFE) c. The market risk premium (cell B27) is 7.5%. (Round your intrinsic value to the nearest whole number and per share value to 2 decimal places.) Intrinsic Value Per Share PV(FCFF) PV(FCFE) A B C D E I I H. 1 J K M 8 G 2022 L 2018 2019 2020 2021 A. Input data P/E Cap spending/shr LT Debt ($M) Shares (million) EPS Working capital 10.50 3.20 13,000 1,700 5.00 5,000 10.88 3.55 14,000 1,680 5.201 6,000 11.25 3.92 15,333 1,670 5.63 7,333 11.63 4.28 16,667 1,660 6.07 8,667 12.00 4.65 18,000 1,650 6.50 10,000 8,600 421 B. Cash flow calculations Profits (SM, after tax) Interest ($M, after tax) Chg working cap ($M) Depreciation ($M) Cap spending ($M) 9,000 453 1,000 4,400 5,964 9,667 497 1,333 4,767 6,534 10,333 540 1,333 5,133 7,103 4,200 11,000 583 = (1-tax_rate) xr_debt x LT Debt 1,333 5,500 7,673 Terminal value 8,077 121,936 8,828 107,367 assumes fixed debt ratio after 2022 FCFF (SM) FCFE (SM) 6,889 7,436 7,063 7,900 7,570 8,364 from Value Line current beta /(1 + (1-tax)*debt/equity)] YTM in 2019 on Moody's A2 rated LT debt I C. Discount rate calculations Current beta 1.3 Unlevered beta 1.167 - Terminal growth 0.05 tax_rate 0.21 r_debt 0.041 - Risk-free rate 0.028 Market risk prem 0.08 MV equity Debt/value Levered beta k_equity WACC PV factor for FCFF PV factor for FCFE 90,300 0.13 1.300 0.132 0.119 1.000 1.000 0.12 1.298 0.132 0.119 0.893 0.884 0.12 1.296 0.132 0.120 0.798 0.781 0.12 1.295 0.132 0.120 0.713 0.690 132,000 0.12) 1.293 0.131 0.120 0.637 0.610 0.131 0.120 0.637 0.610 Row 3 x Row 11 linear trend from initial to final value unlevered beta x (1 + (1-tax)*debt/equity] from CAPM and levered beta (1-t)*r_debtD/V + k_equity*(1-D/V) Discount each year at WACC Discount each year at k_equity D. Present values PV(FCFF) PV(FCFE) 6,154 6,570 5,636 6,167 5,395 5,770 5,142 5,383 77,625 65,467 Intrinsic val Equity val Intrin/share 99,953 86,953 51.15 89,357 89,357 52.56