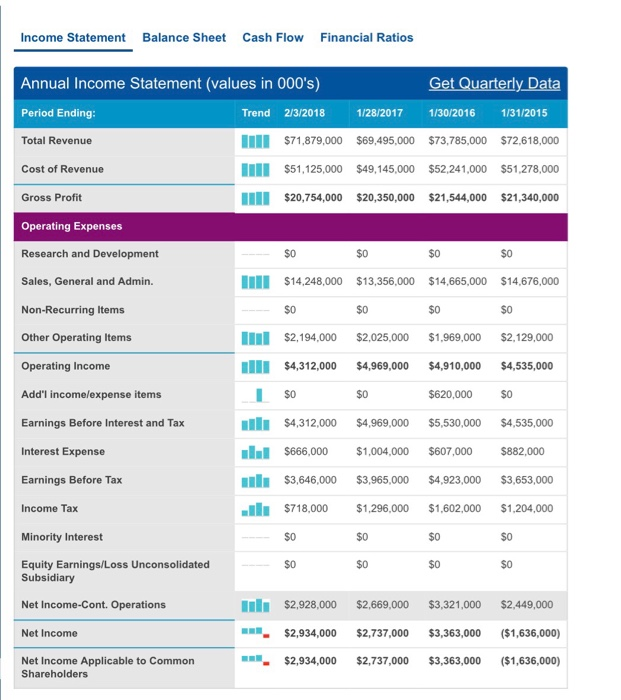
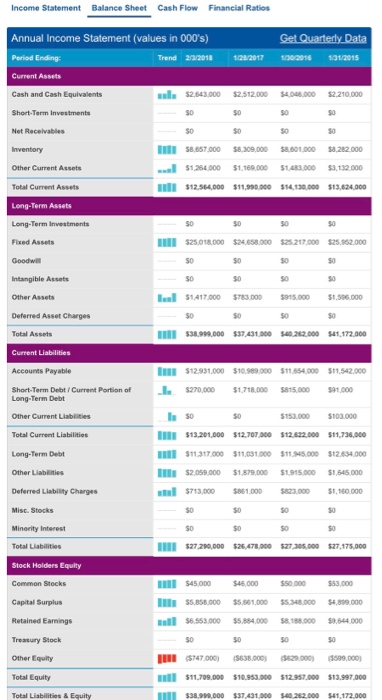
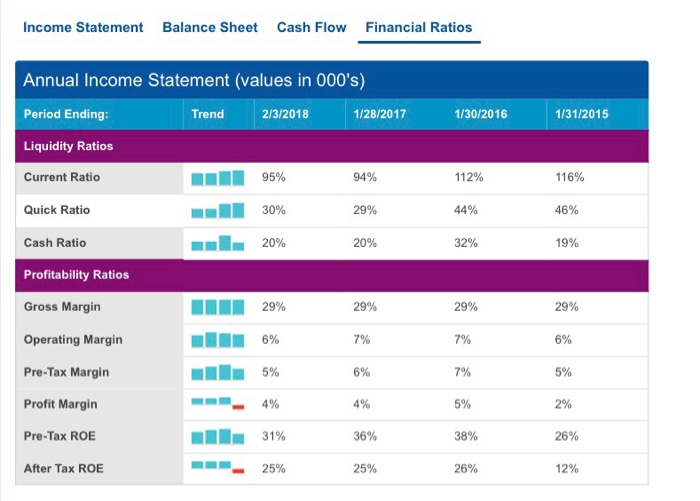
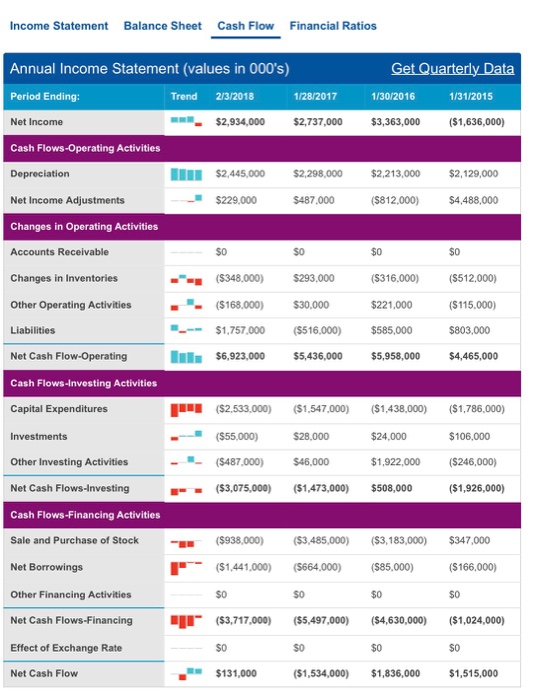
Calculate the intrinsic value of the company using the required rate of return calculated in part 3 above. If the company you chose does not pay dividends, please use Free Cash Flow instead. (15 pts) Compare the intrinsic value calculated in part 4 above to the market price. Would you recommend buying or selling this company? Please explain. (15 pts) Using ratio analysis, talk about the company's liquidity. Use at least 3 or 4 ratios to do this. What does this tell you about the company's liquidity? (5 pts) Using ratio analysis, talk about the company's leverage. Use at least 3 or 4 ratios to do this. What does this tell you about the company's leverage? (5 pts) Income Statement Balance Sheet Cash Flow Financial Ratios Annual Income Statement (values in 000's) Period Ending Total Revenue Trend 2/3/2018 1/28/2017 1/30/2016 1/31/2015 $71,879,000 $69,495,000 $73,785,000 $72,618,000 $51,125,000 $49,145,000 $52,241,000 $51,278,000 $20,754,000 $20,350,000 $21,544,000 $21,340,000 Cost of Revenue Gross Profit Operating Expenses Research and Development Sales, General and Admin. Non-Recurring Items Other Operating Items Operating Income Add'l incomelexpense items Earnings Before Interest and Tax Interest Expense Earnings Before Tax Income Tax SO $14,248,000 $13,356,000 $14,665,000 $14,676,000 SO $2,194,000 $2,025,000 $1,969,000 $2,129,000 $4,312,000 $4,969,000 $4,910,000 $4,535,000 S0 $0 $0 $620,000 SO $4,312000 $4,969,000 $5,530,000 $4,535,000 $666,000 $1,004,000 $607,000 $882,000 $3,646,000 $3,965,000 $4,923,000 $3,653,000 $718,000 $1,296,000 $1,602,000 $1,204,000 Minority Interest S0 $0 $0 Equity Earnings/Loss Unconsolidated S0 $0 Subsidiary Net Income-Cont. Operations Net Income $2,928,000 $2,669,000 $3,321,000 $2,449,000 $2,934,000 $2,737,000 $3,363,000 $1,636,000 $2,934,000 $2,737,000 $3,363,000 ($1,636,000) Net Income Applicable to Common Shareholders Income Statement BalancSheet Cash Flow Financial Ratios Annual Income Statement (values in 000's) Period Ending Current Assets Cash and Cash Equivalents Short-Term Investments Net Recelvables Trend 2/32018 128/2017 1/302016 131/2015 $2.643000 $2 512.000 $4.046 000$2.210.000 so $0 50 so so $8.857,000 $8.309000 $8 601,000$8.282.000 $1,264 000 $1.169000 1,483000 $3,132.000 $1254000 $11,990000 $14,130 000 $13,624,000 Other Current Assets Total Current Assets Long-Term Assets Long-Term Investments Fixed Assets $25.018000 24 658 000 25 217000 $25.62000 so $0 S0 Intangible Assets Other Assets Deferred Asset Charges Total Assets Current Liabilities Accounts Payable Short-Term Debt/Current Portion of so 5o $1417000 S3000 915.0001,56.000 $12931,000 $10.989 000 S11 854000 $11.542.000 $270,000 $1,718000 815.000 91,000 Long-Term Debt Other Current Liabilities Total Current Liabilitios Long-Term Debt Other Liabiities Deferred Liability Charges Misc. Stocks Minerity Interest Is S 50 153000 103.000 $13.201,00 12,707000 12.82200 11,738,000 $11317.000 $11,031 000 $11 345 000 $12.634 000 $2059,000 $1879 000 $1 915,000 $1,645.000 $713000 1000 823000.10000 s0 S0 $27.290000 26,478 000 $27 305,000 $27,175,000 $0 SO Stock Holders Equity Common Stocks Capital Surplus Retained Earnings Treasury Stock Other Equity Total Equity Total Liabilities & Equity $45.000 $46000 $50.000$53000 $5,858.000 $5 661,000$5348000 $,899000 so llll cs747000) ($638.000) 9000) 509,000) $11,709.000 $10.9300 $12.957.000 $13,997.000 $38 99,000 $37,431,000 0 262.000 $41,172,000 Income Statement Balance Sheet Cash Flow Financial Ratios Annual Income Statement (values in 000's) Period Ending Liquidity Ratios Current Ratio Trend 2/3/2018 1/28/2017 1/30/2016 1/31/2015 94% 29% 20% 112% 116% 46% 19% Quick Ratio 30% 44% Cash Ratio Profitability Ratios Gross Margin Operating Margin Pre-Tax Margin Profit Margin Pre-Tax ROE After Tax ROE 29% 7% 6% 4% 29% 7% 7% 5% 38% 26% 29% 8% 5% 2% 26% 12% 4% 36% 25% 25% Calculate the intrinsic value of the company using the required rate of return calculated in part 3 above. If the company you chose does not pay dividends, please use Free Cash Flow instead. (15 pts) Compare the intrinsic value calculated in part 4 above to the market price. Would you recommend buying or selling this company? Please explain. (15 pts) Using ratio analysis, talk about the company's liquidity. Use at least 3 or 4 ratios to do this. What does this tell you about the company's liquidity? (5 pts) Using ratio analysis, talk about the company's leverage. Use at least 3 or 4 ratios to do this. What does this tell you about the company's leverage? (5 pts) Income Statement Balance Sheet Cash Flow Financial Ratios Annual Income Statement (values in 000's) Period Ending Total Revenue Trend 2/3/2018 1/28/2017 1/30/2016 1/31/2015 $71,879,000 $69,495,000 $73,785,000 $72,618,000 $51,125,000 $49,145,000 $52,241,000 $51,278,000 $20,754,000 $20,350,000 $21,544,000 $21,340,000 Cost of Revenue Gross Profit Operating Expenses Research and Development Sales, General and Admin. Non-Recurring Items Other Operating Items Operating Income Add'l incomelexpense items Earnings Before Interest and Tax Interest Expense Earnings Before Tax Income Tax SO $14,248,000 $13,356,000 $14,665,000 $14,676,000 SO $2,194,000 $2,025,000 $1,969,000 $2,129,000 $4,312,000 $4,969,000 $4,910,000 $4,535,000 S0 $0 $0 $620,000 SO $4,312000 $4,969,000 $5,530,000 $4,535,000 $666,000 $1,004,000 $607,000 $882,000 $3,646,000 $3,965,000 $4,923,000 $3,653,000 $718,000 $1,296,000 $1,602,000 $1,204,000 Minority Interest S0 $0 $0 Equity Earnings/Loss Unconsolidated S0 $0 Subsidiary Net Income-Cont. Operations Net Income $2,928,000 $2,669,000 $3,321,000 $2,449,000 $2,934,000 $2,737,000 $3,363,000 $1,636,000 $2,934,000 $2,737,000 $3,363,000 ($1,636,000) Net Income Applicable to Common Shareholders Income Statement BalancSheet Cash Flow Financial Ratios Annual Income Statement (values in 000's) Period Ending Current Assets Cash and Cash Equivalents Short-Term Investments Net Recelvables Trend 2/32018 128/2017 1/302016 131/2015 $2.643000 $2 512.000 $4.046 000$2.210.000 so $0 50 so so $8.857,000 $8.309000 $8 601,000$8.282.000 $1,264 000 $1.169000 1,483000 $3,132.000 $1254000 $11,990000 $14,130 000 $13,624,000 Other Current Assets Total Current Assets Long-Term Assets Long-Term Investments Fixed Assets $25.018000 24 658 000 25 217000 $25.62000 so $0 S0 Intangible Assets Other Assets Deferred Asset Charges Total Assets Current Liabilities Accounts Payable Short-Term Debt/Current Portion of so 5o $1417000 S3000 915.0001,56.000 $12931,000 $10.989 000 S11 854000 $11.542.000 $270,000 $1,718000 815.000 91,000 Long-Term Debt Other Current Liabilities Total Current Liabilitios Long-Term Debt Other Liabiities Deferred Liability Charges Misc. Stocks Minerity Interest Is S 50 153000 103.000 $13.201,00 12,707000 12.82200 11,738,000 $11317.000 $11,031 000 $11 345 000 $12.634 000 $2059,000 $1879 000 $1 915,000 $1,645.000 $713000 1000 823000.10000 s0 S0 $27.290000 26,478 000 $27 305,000 $27,175,000 $0 SO Stock Holders Equity Common Stocks Capital Surplus Retained Earnings Treasury Stock Other Equity Total Equity Total Liabilities & Equity $45.000 $46000 $50.000$53000 $5,858.000 $5 661,000$5348000 $,899000 so llll cs747000) ($638.000) 9000) 509,000) $11,709.000 $10.9300 $12.957.000 $13,997.000 $38 99,000 $37,431,000 0 262.000 $41,172,000 Income Statement Balance Sheet Cash Flow Financial Ratios Annual Income Statement (values in 000's) Period Ending Liquidity Ratios Current Ratio Trend 2/3/2018 1/28/2017 1/30/2016 1/31/2015 94% 29% 20% 112% 116% 46% 19% Quick Ratio 30% 44% Cash Ratio Profitability Ratios Gross Margin Operating Margin Pre-Tax Margin Profit Margin Pre-Tax ROE After Tax ROE 29% 7% 6% 4% 29% 7% 7% 5% 38% 26% 29% 8% 5% 2% 26% 12% 4% 36% 25% 25%