Answered step by step
Verified Expert Solution
Link Copied!

Question

1 Approved Answer

Calculate the MFE, MAD, and MAPE values for April through December 2019 using the chart. Develop a three-period moving average and fill in the table

Calculate the MFE, MAD, and MAPE values for April through December 2019 using the chart. image text in transcribed
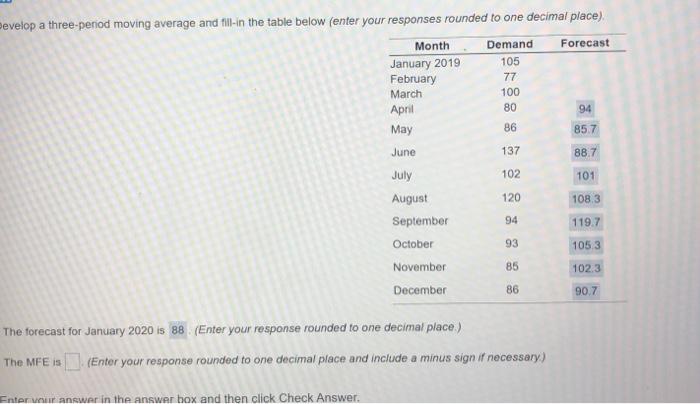
Develop a three-period moving average and fill in the table below (enter your responses rounded to one decimal place) Forecast Demand 105 77 100 80 94 86 85.7 Month January 2019 February March April May June July August September October 137 88.7 102 101 120 108.3 94 119.7 93 1053 November 85 1023 December 86 90.7 The forecast for January 2020 is 88 (Enter your response rounded to one decimal place) The MFE is (Enter your response rounded to one decimal place and include a minus sign if necessary) Enterur answer in the answer box and then click Check

Step by Step Solution

There are 3 Steps involved in it

Step: 1

blur-text-image

Get Instant Access to Expert-Tailored Solutions

See step-by-step solutions with expert insights and AI powered tools for academic success

Step: 2

blur-text-image

Step: 3

blur-text-image

Ace Your Homework with AI

Get the answers you need in no time with our AI-driven, step-by-step assistance

Get Started

Recommended Textbook for

Winning Your Audit

Authors: Holmes F. Crouch

1st Edition

0945339151, 978-0945339151

More Books

Students also viewed these Accounting questions

Question

f. Did they change their names? For what reasons?

Answered: 1 week ago