Answered step by step
Verified Expert Solution
Question
1 Approved Answer
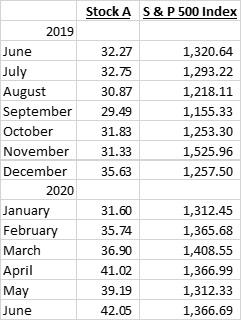
Calculate the monthly holding-period return for Stock A and the S&P 500 Index. What are the average monthly returns and standard deviation for each? Graph

Calculate the monthly holding-period return for Stock A and the S&P 500 Index. What are the average monthly returns and standard deviation for each? Graph the Stock A returns against the S&P 500 Index returns? Use a spreadsheet to calculate the slope of the characteristic line and insert the line into the graph.
Stock A S&P 500 Index 2019 June July August September October November December 2020 January February March 32.27 32.75 30.87 29.49 31.83 31.33 35.63 1,320.64 1,293.22 1,218.11 1,155.33 1,253.30 1,525.96 1,257.50 31.60 35.74 1,312.45 1,365.68 1,408.55 1,366.99 1,312.33 1,366.69 36.90 41.02 39.19 42.05 April May JuneStep by Step Solution
There are 3 Steps involved in it
Step: 1

Get Instant Access to Expert-Tailored Solutions
See step-by-step solutions with expert insights and AI powered tools for academic success
Step: 2

Step: 3

Ace Your Homework with AI
Get the answers you need in no time with our AI-driven, step-by-step assistance
Get Started


