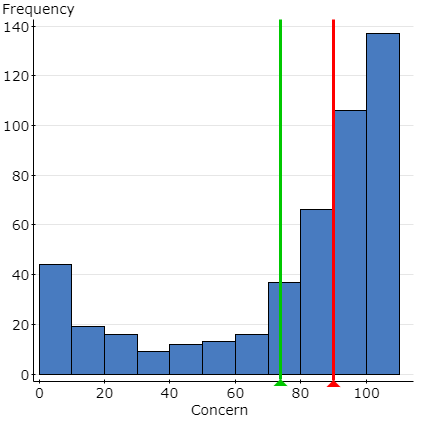
Calculate the numeric summaries of the ?Concern? data, including the mean and the median. Paste the output here. Comment on the values of the mean and median and how they reflect the shape of the histogram above.
Histogramclose Select column(s): Object 1 Select more than one with (Shift+click) or (Ctrl+click) Concern Where: Loading data ... Edit Save Copy Print Downlo ad Refresh Delete Group by: --optional--ConcernStateCollegeGender Type: FrequencyRelative FrequencyDensity Bins: Gulf Oil Spill Concern.csv Start at: Width: Display options: Row --optional--NormalBetaChidistrib.: Concern Overlay State College SquareExponentialGammaFTUniformWeibull Gender 1 75 Hawaii No Male 2 80 California Std. Dev.: No Male 3 20 Missouri Alpha: Yes Male 4 90 Minnesota Beta: No Female 5 100 California DF: Yes Female 6 95 Iowa Mean: Yes Female 7 25 Virginia Alpha: No Male 8 97 Tennessee Beta: Yes Female 9 98 Texas Num. DF: Yes Female 10 40 Georgia Den. DF: Yes Female 11 100 Maryland DF: No Female 12 10 Florida A: Yes Male 13 90 WashingtonB: No Female 14 100 North Carolina Alpha: No Female Mean: Object 2 Beta: var5 15 2 Outside of the United States Yes Female 16 100 Washington No Male 17 75 California Yes Female 18 95 Illinois No Male 19 95 Texas Yes Female 20 95 California Yes Female 21 98 North Carolina Yes Female 22 100 Illinois Yes Female 23 91 Indiana Yes Female 24 100 California Yes Female 25 95 California Yes Female 0 0 000 About Sign out Results Show All Hide All Delete All Hidden Showing 1. Histogram for Concern Session Download Upload Applets Bayes rule Confidence intervals for a proportion for a mean Plotter Contingency table Correlation by eye Distribution demos Experiment Flip coin Roll die Draw cards Birthdays Spinner Games Fair dice? Let's make a deal Are you a psychic? Histogram with sliders Hypothesis tests for a proportion for a mean Mean/SD vs. Median/IQR Random numbers Regression by eye Influence Simulation Resampling Bootstrap a statistic Randomization test for correlation Randomization test for slope Randomization test for two proportions Randomization test for two means Sampling distributions Simulation Birthday problem Coin flipping Dice rolling Poker hands Raffle winnings Urn sampling Spinner StatCrunchThis New Data Table Open statcrunch.com Developer Console Coin prototype Dice prototype Stock market prototype Sample from a population Binomial applet prototype Bar Plot With Data With Summary Pie Chart With Data With Summary Chart Columns Group Stats Histogram Stem and Leaf Boxplot Dotplot Means Plot Scatter Plot Bubble Plot Multi Plot QQ Plot Index/Time Plot Pairs Plot Parallel Coordinates Stars Plot 3D Rotating Plot Word Wall Map US States US Locations Google Map Bayes rule Confidence intervals for a proportion for a mean Plotter Contingency table Correlation by eye Distribution demos Experiment Flip coin Roll die Draw cards Birthdays Spinner Games Fair dice? Let's make a deal Are you a psychic? Histogram with sliders Hypothesis tests for a proportion for a mean Mean/SD vs. Median/IQR Random numbers Regression by eye Influence Simulation Resampling Bootstrap a statistic Randomization test for correlation Randomization test for slope Randomization test for two proportions Randomization test for two means Sampling distributions Simulation Birthday problem Coin flipping Dice rolling Poker hands Raffle winnings Urn sampling Spinner StatCrunchThis Getting Started Browse/Search Docs Browse/Search Examples YouTube Videos Student Study Card Contact Support Calculators Beta Binomial Cauchy Chi-Square Discrete Uniform Exponential F Gamma Geometric # of failures # of trials Hypergeometric Lognormal Normal Poisson T Uniform Weibull Custom Summary Stats Columns Rows Correlation Covariance Grouped/Binned data Tables Frequency Contingency With Data With Summary Outcome Z Stats One Sample With Data With Summary Power/Sample Size Width/Sample Size Two Sample With Data With Summary Power/Sample Size Width/Sample Size T Stats One Sample With Data With Summary Power/Sample Size Width/Sample Size Two Sample With Data With Summary Power/Sample Size Width/Sample Size Paired Proportion Stats One Sample With Data With Summary Power/Sample Size Width/Sample Size Two Sample With Data With Summary Power/Sample Size Width/Sample Size Variance Stats One Sample With Data With Summary Power/Sample Size Width/Sample Size Two Sample With Data With Summary Homogeneity Regression Simple Linear Polynomial Multiple Linear Logistic With Data With Summary ANOVA One Way Two Way Repeated Measures Nonparametrics Sign Test Wilcoxon Signed Ranks Mann-Whitney Kruskal-Wallis Friedman Spearman's Correlation Goodness-of-fit Chi-Square Test Normality Test Control Charts X-bar R X-bar, R np p c u Resample Statistic Applets Bootstrap a statistic Randomization for correlation Randomization for two proportions Randomization for two means Name: Gulf Oil Spill Concern.csv Use first line as column names: yes Delimiter: comma Share with everyone: no Owner: jc25411 Last edited: Jul 28, 2017 Size: 12KB Views: 0 My results for this data: None Results shared by others: None My reports for this data: None Comments Want to comment? Posting a comment will send an email to the owner of this item so they may respond in kind. Post This data set has 0 favorites. Add to your favorites Adding a data set to your favorites makes it easier to come back to in the future! Hg ShareThis Copy and Paste Object 3 Functions: absacosarccosarcsinarctanasinatanatan2betweenceilcombconcatcontainscorcoscountcovcum roundroundtorpoisrtrunifsampleseqsetseedshufflesinskewsortsqrtstartsWithstdsubsetsubstrs Choose column for Values: list History : X-axis Y-axis Title Dividers Paint Zoom closerestorecollapsemaximizeminimize close Right-click the image below to copy it! \f


