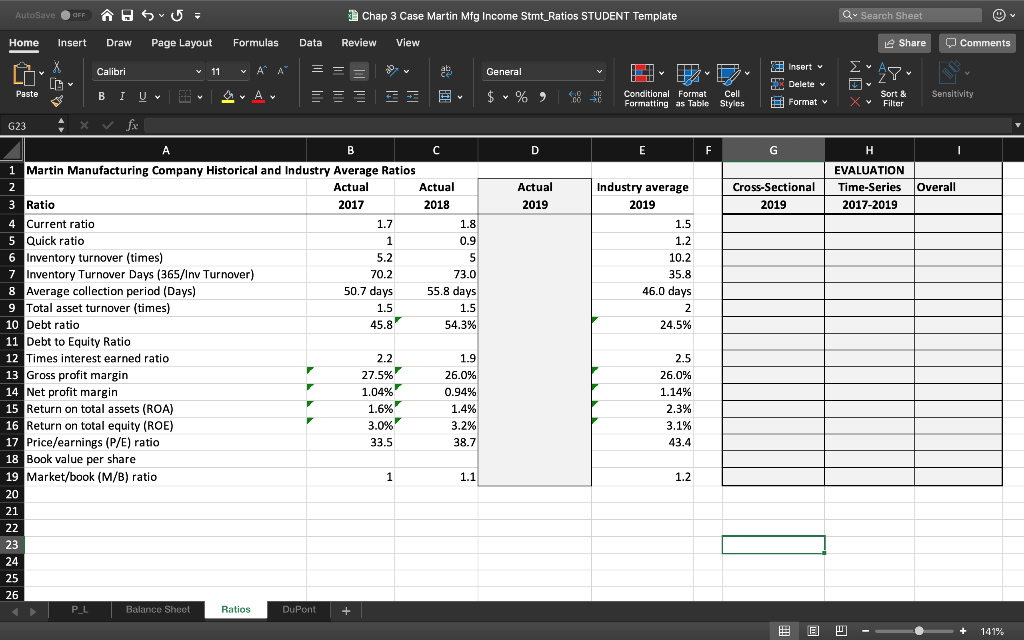
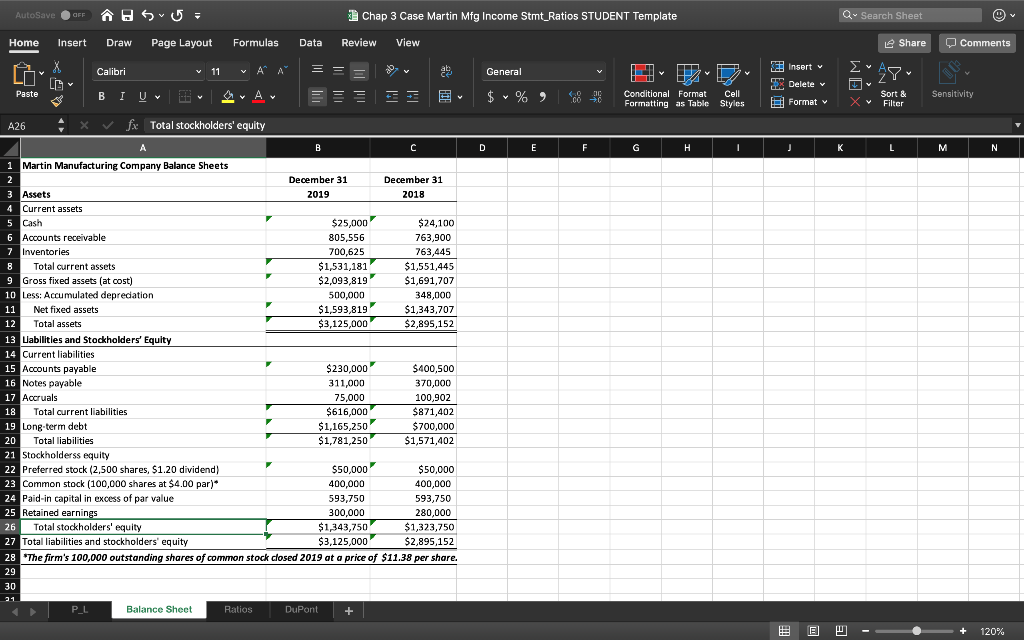
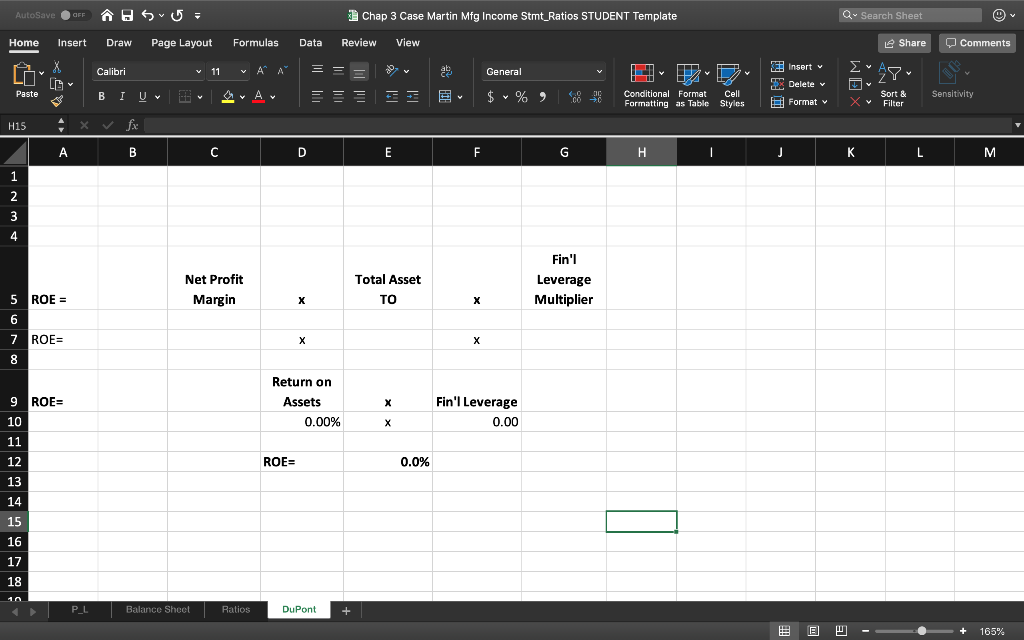
Calculate the ratios


Chap 3 Case Martin Mfg Income Stmt_Ratios STUDENT Template Home Insert Draw Page Layout Formulas Data Review View Share Comments Calibri Conditional Format Cell Formatting as Table Styles Sort &Sensitivity Filter Format G23 Martin Manufacturing Company Historical and Industry Average Ratios EVALUATION Actual Cross-Sectional Time-Series Overall Actua 2017 Actual Industry average 2019 Ratio Current ratio Quick ratio Inventory r (times) Inventory Turnover Days (365/Inv Turnover) 2018 2019 2019 2017-2019 1.7 1.5 1.2 10.2 35.8 46.0 days 0.9 5.2 70.2 50.7 days 1.5 45.8 73.0 55.8 days 1.5 54.3%, 8Average collection period (Days) Total asset turnover (times) Debt ratio Debt to Equity Ratio Times interest earned ratio 245% 2.2 27.5% 1.04% 2.5 26.0% 1.14% 2.3% 3.1% 43.4 12 13 Gross profit margin 14 5 Return on total assets (ROA) 16 17 1.9 26.0% 0.94% 1.4% 3.2% Net profit margin 1.6%, 3.0%, 33.5 Return on total equity (ROE) Price/earnings (P/E) ratio Book value per share Market/book (M/B) ratio 38.7 19 20 21 1.1 1.2 23 24 25 26 P L Balance Shect Ratios 141% Chap 3 Case Martin Mfg Income Stmt_Ratios STUDENT Template Home Insert Draw Page Layout Formulas Data Review View Comments Calibri Conditional Format Cell Formatting as Table Styles Sort &Sensitivity Filter A26 xfe Total stockholders' equity Martin Manufacturing Company Balance Sheets December 31 2019 December 31 2018 Assets Current assets Cash Accounts receivable Inventories $25,000 805,556 700,625 1,531,181 2,093,819 500,000 $1,593,819 $3,125,000 $24,100 763,900 763,445 1,551,445 1,691,707 348,000 $1,343,707 $2,895,152 Total current assets Gross fixed assets (at cost Less: Accumulated depredation Net fixed assets Total assets Labilities and Stockholders' Equity Current liabilities Accounts payable Notes payable Accruals 13 14 15 230,000 311,000 75,000 $616,000 $1,165,250 1,781,250 400,500 370,000 100,902 $871,402 $700,000 $1,571,402 18 Total current liabilities Long term debt 20 Total liabilities Stockholderss equity Preferred stock (2,500 shares, $1.20 dividend Common stock (100,000 shares at $4.00 par)* Paid-in capital in excess of par value Retained earni $50,000 400,000 593,750 300,000 1,343,750 $3,125,000 $50,000 400,000 593,750 280,000 $1,323,750 2,895,152 23 25 Total stockholders' equity Total liabilities and stockholders' equity The firm's 100,000 outstanding shares of common stock closed 2019 at a price of $11.38 per share. 28 29 Balance Sheet Ratios 120% Chap 3 Case Martin Mfg Income Stmt-Ratios STUDENT Template Share Comments Home Insert Draw Page Layout Formulas Data Review View Insert v Delete Format Calibri 11 A A Conditional Format Cell Formatting as Table Styles Sort &Sensitivity Filter H15 4 Total Asset TO Fin'l Leverage Multiplier Net Profit ROE = Margin 6 ROE= Return on Fin'l Leverage 0.00 Assets ROE 0.00% 10 ROE- 0.0% 12 13 14 15 16 17 18 P L Balance Shect -. 165% Chap 3 Case Martin Mfg Income Stmt_Ratios STUDENT Template Home Insert Draw Page Layout Formulas Data Review View Share Comments Calibri Conditional Format Cell Formatting as Table Styles Sort &Sensitivity Filter Format G23 Martin Manufacturing Company Historical and Industry Average Ratios EVALUATION Actual Cross-Sectional Time-Series Overall Actua 2017 Actual Industry average 2019 Ratio Current ratio Quick ratio Inventory r (times) Inventory Turnover Days (365/Inv Turnover) 2018 2019 2019 2017-2019 1.7 1.5 1.2 10.2 35.8 46.0 days 0.9 5.2 70.2 50.7 days 1.5 45.8 73.0 55.8 days 1.5 54.3%, 8Average collection period (Days) Total asset turnover (times) Debt ratio Debt to Equity Ratio Times interest earned ratio 245% 2.2 27.5% 1.04% 2.5 26.0% 1.14% 2.3% 3.1% 43.4 12 13 Gross profit margin 14 5 Return on total assets (ROA) 16 17 1.9 26.0% 0.94% 1.4% 3.2% Net profit margin 1.6%, 3.0%, 33.5 Return on total equity (ROE) Price/earnings (P/E) ratio Book value per share Market/book (M/B) ratio 38.7 19 20 21 1.1 1.2 23 24 25 26 P L Balance Shect Ratios 141% Chap 3 Case Martin Mfg Income Stmt_Ratios STUDENT Template Home Insert Draw Page Layout Formulas Data Review View Comments Calibri Conditional Format Cell Formatting as Table Styles Sort &Sensitivity Filter A26 xfe Total stockholders' equity Martin Manufacturing Company Balance Sheets December 31 2019 December 31 2018 Assets Current assets Cash Accounts receivable Inventories $25,000 805,556 700,625 1,531,181 2,093,819 500,000 $1,593,819 $3,125,000 $24,100 763,900 763,445 1,551,445 1,691,707 348,000 $1,343,707 $2,895,152 Total current assets Gross fixed assets (at cost Less: Accumulated depredation Net fixed assets Total assets Labilities and Stockholders' Equity Current liabilities Accounts payable Notes payable Accruals 13 14 15 230,000 311,000 75,000 $616,000 $1,165,250 1,781,250 400,500 370,000 100,902 $871,402 $700,000 $1,571,402 18 Total current liabilities Long term debt 20 Total liabilities Stockholderss equity Preferred stock (2,500 shares, $1.20 dividend Common stock (100,000 shares at $4.00 par)* Paid-in capital in excess of par value Retained earni $50,000 400,000 593,750 300,000 1,343,750 $3,125,000 $50,000 400,000 593,750 280,000 $1,323,750 2,895,152 23 25 Total stockholders' equity Total liabilities and stockholders' equity The firm's 100,000 outstanding shares of common stock closed 2019 at a price of $11.38 per share. 28 29 Balance Sheet Ratios 120% Chap 3 Case Martin Mfg Income Stmt-Ratios STUDENT Template Share Comments Home Insert Draw Page Layout Formulas Data Review View Insert v Delete Format Calibri 11 A A Conditional Format Cell Formatting as Table Styles Sort &Sensitivity Filter H15 4 Total Asset TO Fin'l Leverage Multiplier Net Profit ROE = Margin 6 ROE= Return on Fin'l Leverage 0.00 Assets ROE 0.00% 10 ROE- 0.0% 12 13 14 15 16 17 18 P L Balance Shect -. 165%


