

Answered step by step
Verified Expert Solution
Question
1 Approved Answer
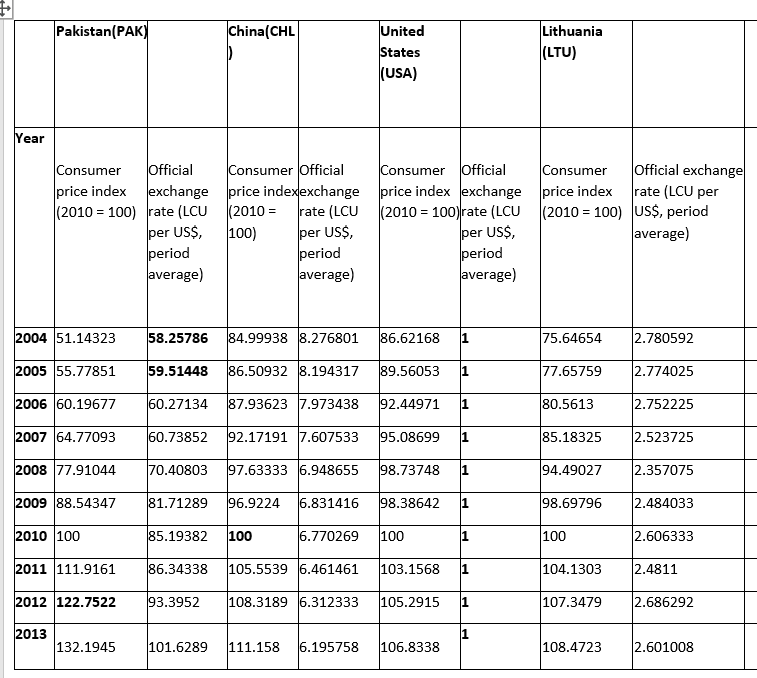
Calculate the real exchange rate, nominal effective and real effective exchange rates for Pakistan for at least 10 years using the given trade shares; European
- Calculate the real exchange rate, nominal effective and real effective exchange rates for Pakistan for at least 10 years using the given trade shares; European market union-33%, China - 24% and USA 16%.
- Analyze the relationship between the exchange rates calculated using graph.
Step by Step Solution
There are 3 Steps involved in it
Step: 1

Get Instant Access to Expert-Tailored Solutions
See step-by-step solutions with expert insights and AI powered tools for academic success
Step: 2

Step: 3
Ace Your Homework with AI
Get the answers you need in no time with our AI-driven, step-by-step assistance
Get Started
Managerial Accounting 1
Authors: Ray H. Garrison
1st Edition
1259114457, 978-1259114458