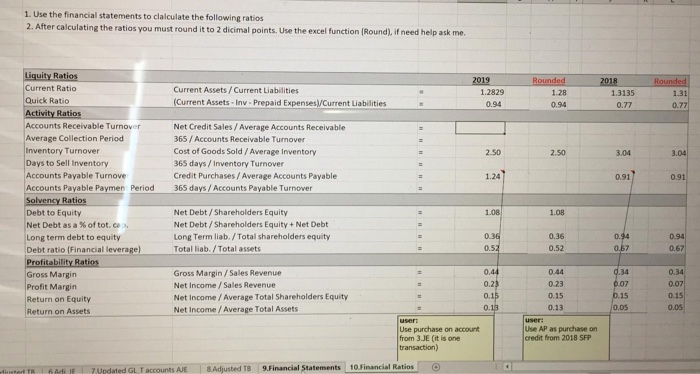
Calculate the remaining ratios.
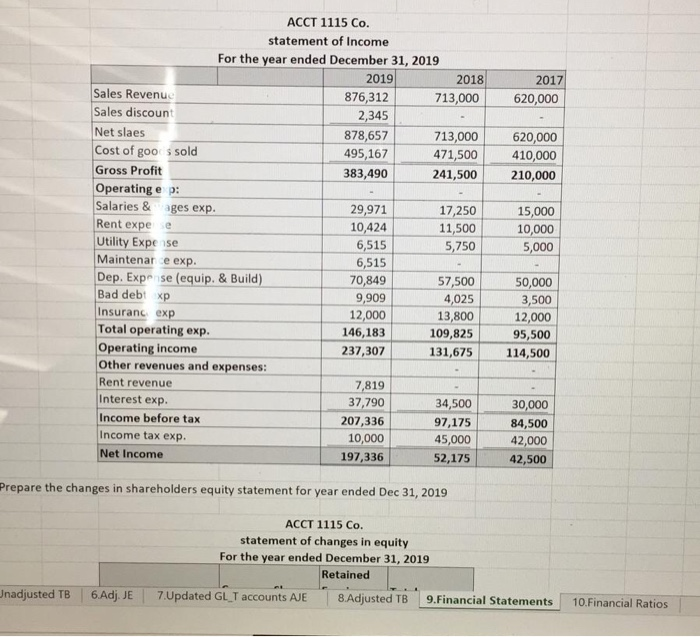
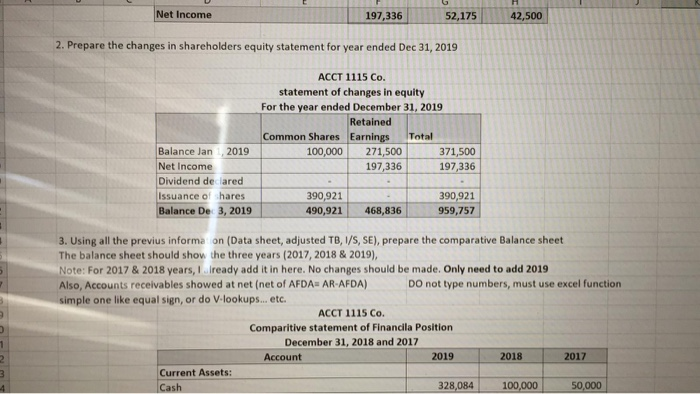
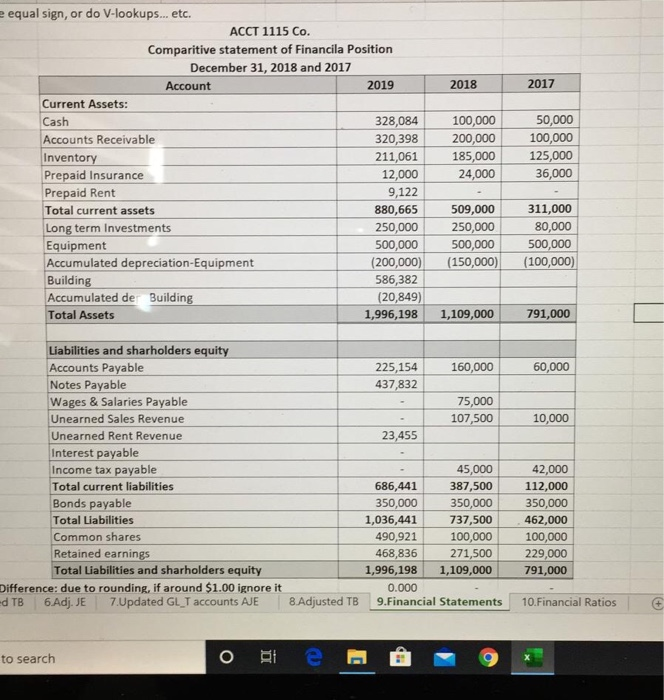
2017 620,000 620,000 410,000 210,000 ACCT 1115 Co. statement of Income For the year ended December 31, 2019 2019 2018 Sales Revenue 876,312 713,000 Sales discount 2,345 Net slaes 878,657 713,000 Cost of goo s sold 495,167 471,500 Gross Profit 383,490 241,500 Operating e p: Salaries & ages exp. 29,971 17,250 Rent expee 10,424 11,500 Utility Expe se 6,515 5,750 Maintenar e exp. 6,515 Dep. Exp se (equip. & Build) 70,849 57,500 Bad debt xp 9,909 4,025 Insuranc exp 12,000 13,800 Total operating exp. 146,183 109,825 Operating income 237,307 131,675 Other revenues and expenses: Rent revenue 7,819 Interest exp. 37,790 34,500 Income before tax 207,336 97,175 Income tax exp. 10,000 45,000 Net Income 197,336 52,175 15,000 10,000 5,000 50,000 3,500 12,000 95,500 114,500 30,000 84,500 42,000 42,500 Prepare the changes in shareholders equity statement for year ended Dec 31, 2019 ACCT 1115 Co. statement of changes in equity For the year ended December 31, 2019 Retained 7.Updated GL_T accounts AJE 8. Adjusted TB9.Financial Statements nadjusted TB 6.Adj. JE 10. Financial Ratios Net Income 197,336 52,175 42,500 2. Prepare the changes in shareholders equity statement for year ended Dec 31, 2019 ACCT 1115 Co. statement of changes in equity For the year ended December 31, 2019 Retained Common Shares Earnings Total 100,000 271,500 371,500 197,336 197,336 Balance Jan, 2019 Net Income Dividend de lared Issuance of hares Balance De 3, 2019 390,921 490,921 390,921 959,757 468,836 3. Using all the previus informa on (Data sheet, adjusted TB, I/S, SE), prepare the comparative Balance sheet The balance sheet should show the three years (2017, 2018 & 2019), Note: For 2017 & 2018 years, ready add it in here. No changes should be made. Only need to add 2019 Also, Accounts receivables showed at net (net of AFDAH AR-AFDA) DO not type numbers, must use excel function simple one like equal sign, or do V.lookups... etc. ACCT 1115 Co. Comparitive statement of Financila Position December 31, 2018 and 2017 Account 2019 2018 2017 Current Assets: Cash 328,084 100,000 50,000 2018 2017 e equal sign, or do V-lookups... etc. ACCT 1115 Co. Comparitive statement of Financila Position December 31, 2018 and 2017 Account 2019 Current Assets: Cash 328,084 Accounts Receivable 320,398 Inventory 211,061 Prepaid Insurance 12,000 Prepaid Rent 9,122 Total current assets 880,665 Long term Investments 250,000 Equipment 500,000 Accumulated depreciation Equipment (200,000) Building 586,382 Accumulated der Building (20,849) Total Assets 1,996,198 100,000 200,000 185,000 24,000 50,000 100,000 125,000 36,000 509,000 250,000 500,000 (150,000) 311,000 80,000 500,000 (100,000) 1,109,000 791,000 160,000 60,000 225,154 437,832 75,000 107,500 10,000 23,455 Liabilities and sharholders equity Accounts Payable Notes Payable Wages & Salaries Payable Unearned Sales Revenue Unearned Rent Revenue Interest payable Income tax payable Total current liabilities Bonds payable Total Liabilities Common shares Retained earnings Total Liabilities and sharholders equity Difference: due to rounding, if around $1.00 ignore it d TB 6.Adj. JE 7.Updated GL_T accounts AJE 45,000 686,441 387,500 350,000 350,000 1,036,441 737,500 490,921 100,000 468,836 271,500 1,996,198 1,109,000 0.000 9.Financial Statements 42,000 112,000 350,000 462,000 100,000 229,000 791,000 8. Adjusted TB 10. Financial Ratios to search ote 1. Use the financial statements to clalculate the following ratios 2. After calculating the ratios you must round it to 2 dicimal points. Use the excel function (Round), if need help ask me. 2019 2018 Rounded Current Assets / Current Liabilities (Current Assets - Iny. Prepaid Expenses Current Liabilities 1.2829 0.94 Rounded 1.28 0.94 1.3135 0.77 1.31 0.77 Net Credit Sales / Average Accounts Receivable 365 / Accounts Receivable Turnover Cost of Goods Sold / Average Inventory 365 days / Inventory Turnover Credit Purchases / Average Accounts Payable 365 days / Accounts Payable Turnover 2.50 2.50 3.04 1.24) 0.91 0.91 Liquity Ratios Current Ratio Quick Ratio Activity Ratios Accounts Receivable Turnover Average Collection Period Inventory Turnover Days to Sell Inventory Accounts Payable Turnove Accounts Payable Paymen Period Solvency Ratios Debt to Equity Net Debt as a % of tot, ce Long term debt to equity Debt ratio (Financial leverage) Profitability Ratios Gross Margin Profit Margin Return on Equity Return on Assets 1.08 1.08 Net Debt/Shareholders Equity Net Debt/Shareholders Equity + Net Debt Long Term liab./Total shareholders equity Total liab./ Total assets 0.36 0.36 0.94 0.67 0.52 0.94 0.67 0.52 0.44 0.44 0.23 Gross Margin / Sales Revenue Net Income / Sales Revenue Net Income / Average Total Shareholders Equity Net Income / Average Total Assets 0.23 0.15 0.34 0.07 0.15 0.34 0.07 0.15 0.05 0.15 0.13 0.13 OOS Use purchase on account from 3.JE (it is one transaction) Use AP as purchase on credit from 2018 SFP istert TR A JE 7 Updated GL accounts AJE 8 Adjusted T8 9.Financial Statements 10 Financial Ratios @


