Calculate the required return on investment for AMAZON using various methods including CAPM approach.
Calculate the fair value of AMAZON and its expected return.
Calculate the implied return for the AMAZON stock.
Calculate alpha the risk adjusted excess return.
State and explain your opinion as to whether or not you should buy or sell the company.
DATA:
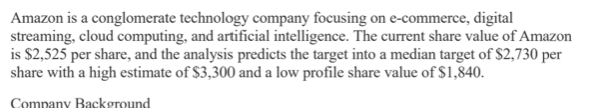
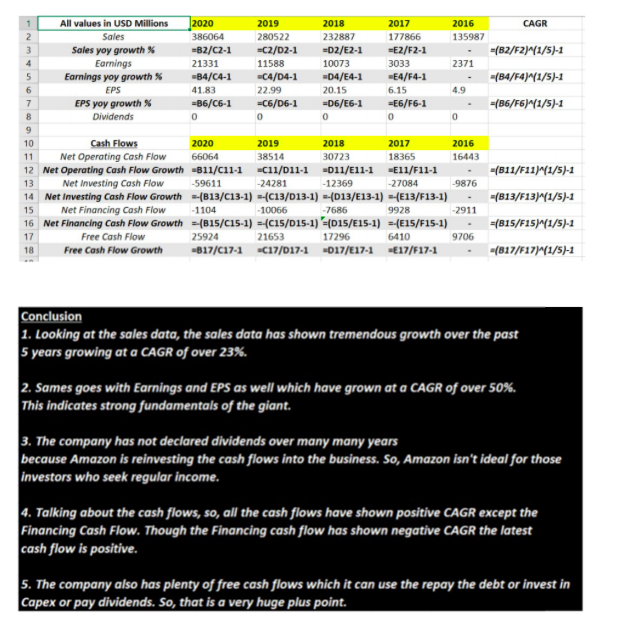
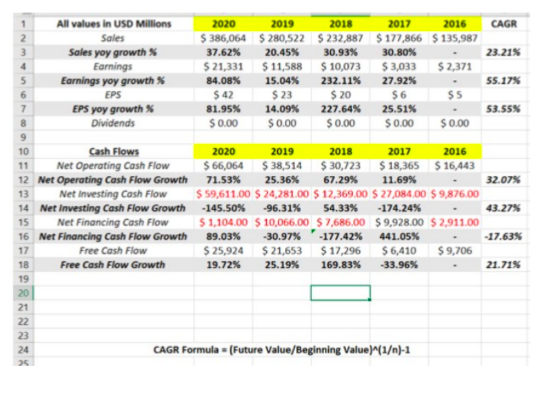
Amazon is a conglomerate technology company focusing on e-commerce, digital streaming, cloud computing, and artificial intelligence. The current share value of Amazon is $2,525 per share, and the analysis predicts the target into a median target of $2,730 per share with a high estimate of $3,300 and a low profile share value of $1,840. Company Background CAGR =(B2/F2W(1/5)-1 (B4/54)41/5)-1 =(B6/F6)^(1/5)-1 All values in USD Millions 2020 2019 2018 2017 2016 2 Sales 386064 280522 232887 177866 135987 3 Sales yoy growth =B2/C2-1 -C2/D2-1 =D2/E2-1 =E2/F2-1 4 Earnings 21331 11588 10073 3033 2371 5 Earnings yoy growth -B4/C4-1 -C4/04-1 -D4/E4-1 -E4/F4-1 6 EPS 41.83 22.99 20.15 6.15 4.9 7 EPS yoy growth =B6/C6-1 -C6/06-1 -D6/E6-1 =E6/F6-1 8 Dividends 0 0 0 0 0 9 10 Cash Flows 2020 2019 2018 2017 2016 11 Net Operating Cash Flow 66064 38514 30723 18365 16443 12 Net Operating Cash Flow Growth -B11/C11-1 -C11/011-1 011/E11-1 -E11/F11-1 13 Net Investing Cash Flow -59611 -24281 -12369 -27084 -9876 14 Net Investing Cash Flow Growth =-(813/C13-1) =-(C13/013-1) =-(013/E13-1) =-(E13/F13-1) 15 Net Financing Cash Flow -1104 -10066 -7686 9928 -2911 16 Net Financing Cash Flow Growth =-(B15/C15-1) =-(C15/015-1) '(015/E15-1) =-(E15/F15-1) 17 Free Cash Flow 25924 21653 17296 6410 9706 18 Free Cash Flow Growth -B17/017-1 C17/017-1 -017/E17-1 E17/F17-1 (B11/F11)^(1/5)-1 =(B13/F13)^(1/5)-2 (B15/F1S (1/5) 1 -(817/F17)^(1/5)-1 Conclusion 1. Looking at the sales data, the sales data has shown tremendous growth over the past 5 years growing at a CAGR of over 23%. 2. Sames goes with Earnings and EPS as well which have grown at a CAGR of over 50%. This indicates strong fundamentals of the giant. 3. The company has not declared dividends over many many years because Amazon is reinvesting the cash flows into the business. So, Amazon isn't ideal for those investors who seek regular income. 4. Talking about the cash flows, so, all the cash flows have shown positive CAGR except the Financing Cash Flow. Though the Financing cash flow has shown negative CAGR the latest cash flow is positive. 5. The company also has plenty of free cash flows which it can use the repay the debt or invest in Capex or pay dividends. So, that is a very huge plus point $0.00 All values in USD Millions 2020 2019 2018 2017 2016 CAGR 2 Sales $ 386,064 $ 280,522 $ 232,887 $177,866 $ 135,987 3 Sales yoy growth 37.62% 20.45% 30.93% 30.80% 23.215 4 Earnings $ 21,331 $ 11,588 $ 10,073 $ 3,033 $ 2,371 5 Earnings yoy growth 84.08% 15.04% 232.11% 27.92% 55.17% 6 EPS $ 42 $ 23 $ 20 $6 $5 7 EPS yoy growth 81.95% 14.09% 227.64% 25.51% 53.55% 8 Dividends $ 0.00 $ 0.00 $ 0.00 $ 0.00 9 10 Cash Flows 2020 2019 2018 2017 2016 11 Net Operating Cash Flow $ 66,064 $ 38,514 $ 30,723 $18,365 $16,443 12 Net Operating Cash Flow Growth 71.53% 25.36% 67.29% 11.69% 32.07% 13 Net Investing Cash Flow $ 59,611.00 $ 24,281.00 $ 12,369.00 $ 27,084.00 $ 9,876.00 14 Net Investing Cash Flow Growth -145.50% -96.31% 54.33% -174.24% 43.27% 15 Net Financing Cash Flow $ 1,104.00 $ 10,066.00 $ 7,686.00 $9,928.00 $ 2,911.00 16 Net Financing Cash Flow Growth 89.03% -30.97% -177.42% 441.05% -17.63% 17 Free Cash Flow $ 25,924 $ 21,653 $ 17,296 $ 6,410 $ 9,706 18 Free Cash Flow Growth 19.72% 25.19% 169.83% -33.96% 21.715 19 20 21 22 23 24 CAGR Formula - (Future Value/Beginning Value)^(1)-1 26 Amazon is a conglomerate technology company focusing on e-commerce, digital streaming, cloud computing, and artificial intelligence. The current share value of Amazon is $2,525 per share, and the analysis predicts the target into a median target of $2,730 per share with a high estimate of $3,300 and a low profile share value of $1,840. Company Background CAGR =(B2/F2W(1/5)-1 (B4/54)41/5)-1 =(B6/F6)^(1/5)-1 All values in USD Millions 2020 2019 2018 2017 2016 2 Sales 386064 280522 232887 177866 135987 3 Sales yoy growth =B2/C2-1 -C2/D2-1 =D2/E2-1 =E2/F2-1 4 Earnings 21331 11588 10073 3033 2371 5 Earnings yoy growth -B4/C4-1 -C4/04-1 -D4/E4-1 -E4/F4-1 6 EPS 41.83 22.99 20.15 6.15 4.9 7 EPS yoy growth =B6/C6-1 -C6/06-1 -D6/E6-1 =E6/F6-1 8 Dividends 0 0 0 0 0 9 10 Cash Flows 2020 2019 2018 2017 2016 11 Net Operating Cash Flow 66064 38514 30723 18365 16443 12 Net Operating Cash Flow Growth -B11/C11-1 -C11/011-1 011/E11-1 -E11/F11-1 13 Net Investing Cash Flow -59611 -24281 -12369 -27084 -9876 14 Net Investing Cash Flow Growth =-(813/C13-1) =-(C13/013-1) =-(013/E13-1) =-(E13/F13-1) 15 Net Financing Cash Flow -1104 -10066 -7686 9928 -2911 16 Net Financing Cash Flow Growth =-(B15/C15-1) =-(C15/015-1) '(015/E15-1) =-(E15/F15-1) 17 Free Cash Flow 25924 21653 17296 6410 9706 18 Free Cash Flow Growth -B17/017-1 C17/017-1 -017/E17-1 E17/F17-1 (B11/F11)^(1/5)-1 =(B13/F13)^(1/5)-2 (B15/F1S (1/5) 1 -(817/F17)^(1/5)-1 Conclusion 1. Looking at the sales data, the sales data has shown tremendous growth over the past 5 years growing at a CAGR of over 23%. 2. Sames goes with Earnings and EPS as well which have grown at a CAGR of over 50%. This indicates strong fundamentals of the giant. 3. The company has not declared dividends over many many years because Amazon is reinvesting the cash flows into the business. So, Amazon isn't ideal for those investors who seek regular income. 4. Talking about the cash flows, so, all the cash flows have shown positive CAGR except the Financing Cash Flow. Though the Financing cash flow has shown negative CAGR the latest cash flow is positive. 5. The company also has plenty of free cash flows which it can use the repay the debt or invest in Capex or pay dividends. So, that is a very huge plus point $0.00 All values in USD Millions 2020 2019 2018 2017 2016 CAGR 2 Sales $ 386,064 $ 280,522 $ 232,887 $177,866 $ 135,987 3 Sales yoy growth 37.62% 20.45% 30.93% 30.80% 23.215 4 Earnings $ 21,331 $ 11,588 $ 10,073 $ 3,033 $ 2,371 5 Earnings yoy growth 84.08% 15.04% 232.11% 27.92% 55.17% 6 EPS $ 42 $ 23 $ 20 $6 $5 7 EPS yoy growth 81.95% 14.09% 227.64% 25.51% 53.55% 8 Dividends $ 0.00 $ 0.00 $ 0.00 $ 0.00 9 10 Cash Flows 2020 2019 2018 2017 2016 11 Net Operating Cash Flow $ 66,064 $ 38,514 $ 30,723 $18,365 $16,443 12 Net Operating Cash Flow Growth 71.53% 25.36% 67.29% 11.69% 32.07% 13 Net Investing Cash Flow $ 59,611.00 $ 24,281.00 $ 12,369.00 $ 27,084.00 $ 9,876.00 14 Net Investing Cash Flow Growth -145.50% -96.31% 54.33% -174.24% 43.27% 15 Net Financing Cash Flow $ 1,104.00 $ 10,066.00 $ 7,686.00 $9,928.00 $ 2,911.00 16 Net Financing Cash Flow Growth 89.03% -30.97% -177.42% 441.05% -17.63% 17 Free Cash Flow $ 25,924 $ 21,653 $ 17,296 $ 6,410 $ 9,706 18 Free Cash Flow Growth 19.72% 25.19% 169.83% -33.96% 21.715 19 20 21 22 23 24 CAGR Formula - (Future Value/Beginning Value)^(1)-1 26