Calculate the Return on Assets (ROA), Total assets Turnover (TATO), and Operating Profit Margin (OPM) for Synlait Milk Ltd in 2019 and 2020.
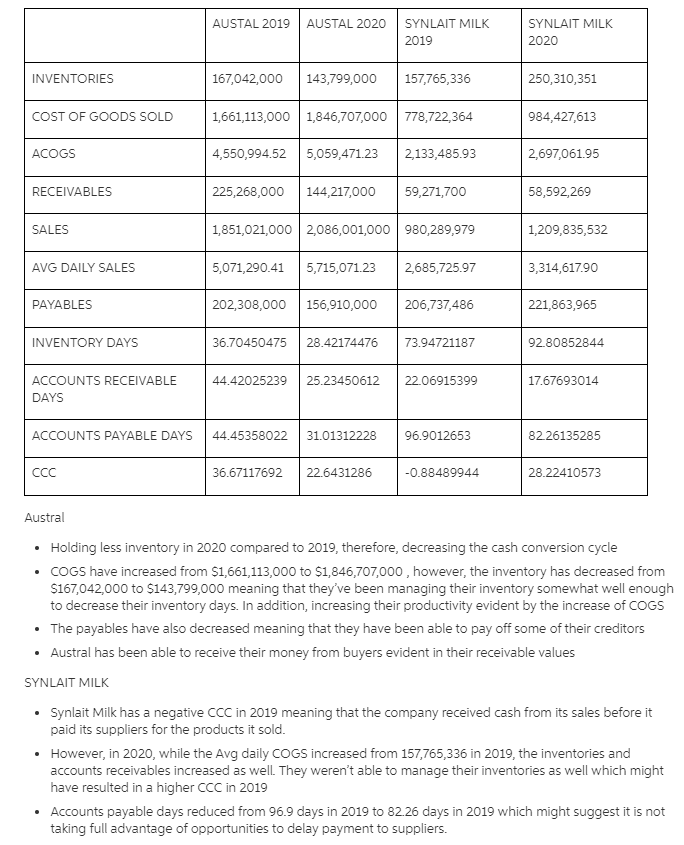
AUSTAL 2019 AUSTAL 2020 SYNLAIT MILK 2019 SYNLAIT MILK 2020 INVENTORIES 167,042,000 143,799,000 157,765,336 250,310,351 COST OF GOODS SOLD 1,661,113,000 1,846,707,000 778,722,364 984,427,613 ACOGS 4,550,994.52 5,059,471.23 2,133,485.93 2,697,061.95 RECEIVABLES 225,268,000 144,217,000 59,271,700 58,592,269 SALES 1,851,021,000 2,086,001,000 980,289,979 1,209,835,532 AVG DAILY SALES 5,071,290.41 5,715,071.23 2,685,725.97 3,314,617.90 PAYABLES 202,308,000 156,910,000 206,737,486 221,863,965 INVENTORY DAYS 36.70450475 28.42174476 73.94721187 92.80852844 ACCOUNTS RECEIVABLE DAYS 44.42025239 25.23450612 22.06915399 17.67693014 ACCOUNTS PAYABLE DAYS 44.45358022 31.01312228 96.9012653 8226135285 CCC 36.67117692 22.6431286 -0.88489944 28.22410573 Austral . Holding less inventory in 2020 compared to 2019, therefore, decreasing the cash conversion cycle COGS have increased from $1,661,113,000 to $1,846,707,000, however, the inventory has decreased from $167,042,000 to $143,799,000 meaning that they've been managing their inventory somewhat well enough to decrease their inventory days. In addition, increasing their productivity evident by the increase of COGS The payables have also decreased meaning that they have been able to pay off some of their creditors Austral has been able to receive their money from buyers evident in their receivable values SYNLAIT MILK Synlait Milk has a negative CCC in 2019 meaning that the company received cash from its sales before it paid its suppliers for the products it sold. However, in 2020, while the Avg daily COGS increased from 157,765,336 in 2019, the inventories and accounts receivables increased as well. They weren't able to manage their inventories as well which might have resulted in a higher CCC in 2019 Accounts payable days reduced from 96.9 days in 2019 to 82.26 days in 2019 which might suggest it is not taking full advantage of opportunities to delay payment to suppliers. AUSTAL 2019 AUSTAL 2020 SYNLAIT MILK 2019 SYNLAIT MILK 2020 INVENTORIES 167,042,000 143,799,000 157,765,336 250,310,351 COST OF GOODS SOLD 1,661,113,000 1,846,707,000 778,722,364 984,427,613 ACOGS 4,550,994.52 5,059,471.23 2,133,485.93 2,697,061.95 RECEIVABLES 225,268,000 144,217,000 59,271,700 58,592,269 SALES 1,851,021,000 2,086,001,000 980,289,979 1,209,835,532 AVG DAILY SALES 5,071,290.41 5,715,071.23 2,685,725.97 3,314,617.90 PAYABLES 202,308,000 156,910,000 206,737,486 221,863,965 INVENTORY DAYS 36.70450475 28.42174476 73.94721187 92.80852844 ACCOUNTS RECEIVABLE DAYS 44.42025239 25.23450612 22.06915399 17.67693014 ACCOUNTS PAYABLE DAYS 44.45358022 31.01312228 96.9012653 8226135285 CCC 36.67117692 22.6431286 -0.88489944 28.22410573 Austral . Holding less inventory in 2020 compared to 2019, therefore, decreasing the cash conversion cycle COGS have increased from $1,661,113,000 to $1,846,707,000, however, the inventory has decreased from $167,042,000 to $143,799,000 meaning that they've been managing their inventory somewhat well enough to decrease their inventory days. In addition, increasing their productivity evident by the increase of COGS The payables have also decreased meaning that they have been able to pay off some of their creditors Austral has been able to receive their money from buyers evident in their receivable values SYNLAIT MILK Synlait Milk has a negative CCC in 2019 meaning that the company received cash from its sales before it paid its suppliers for the products it sold. However, in 2020, while the Avg daily COGS increased from 157,765,336 in 2019, the inventories and accounts receivables increased as well. They weren't able to manage their inventories as well which might have resulted in a higher CCC in 2019 Accounts payable days reduced from 96.9 days in 2019 to 82.26 days in 2019 which might suggest it is not taking full advantage of opportunities to delay payment to suppliers


