

Answered step by step
Verified Expert Solution
Question
1 Approved Answer
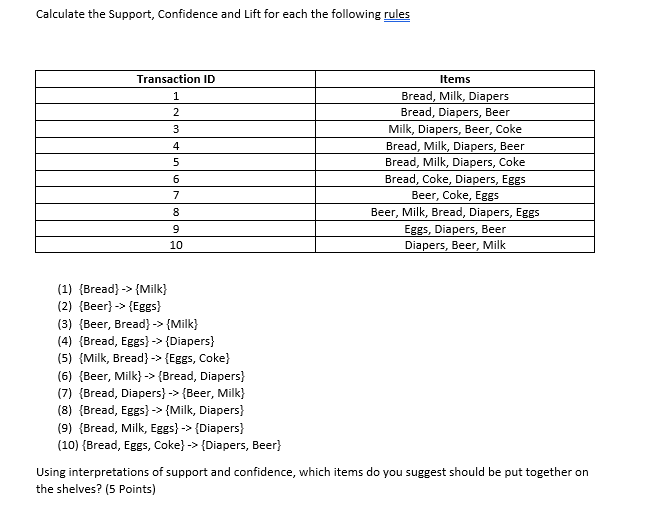
Calculate the Support, Confidence and Lift for each the following rules (1) { Bread }>{ Milk } (2) { Beer }{ Eggs } (3) {
Step by Step Solution
There are 3 Steps involved in it
Step: 1

Get Instant Access to Expert-Tailored Solutions
See step-by-step solutions with expert insights and AI powered tools for academic success
Step: 2

Step: 3
Ace Your Homework with AI
Get the answers you need in no time with our AI-driven, step-by-step assistance
Get Started
Parallel Computation Third International Acpc Conference With Special Emphasis On Parallel Databases And Parallel I/O Klagenfurt Austria September 1996 Proceedings Lncs 1127
Authors: Laszlo Boszormenyi
1st Edition
3540616950, 978-3540616955