Answered step by step
Verified Expert Solution
Question
1 Approved Answer
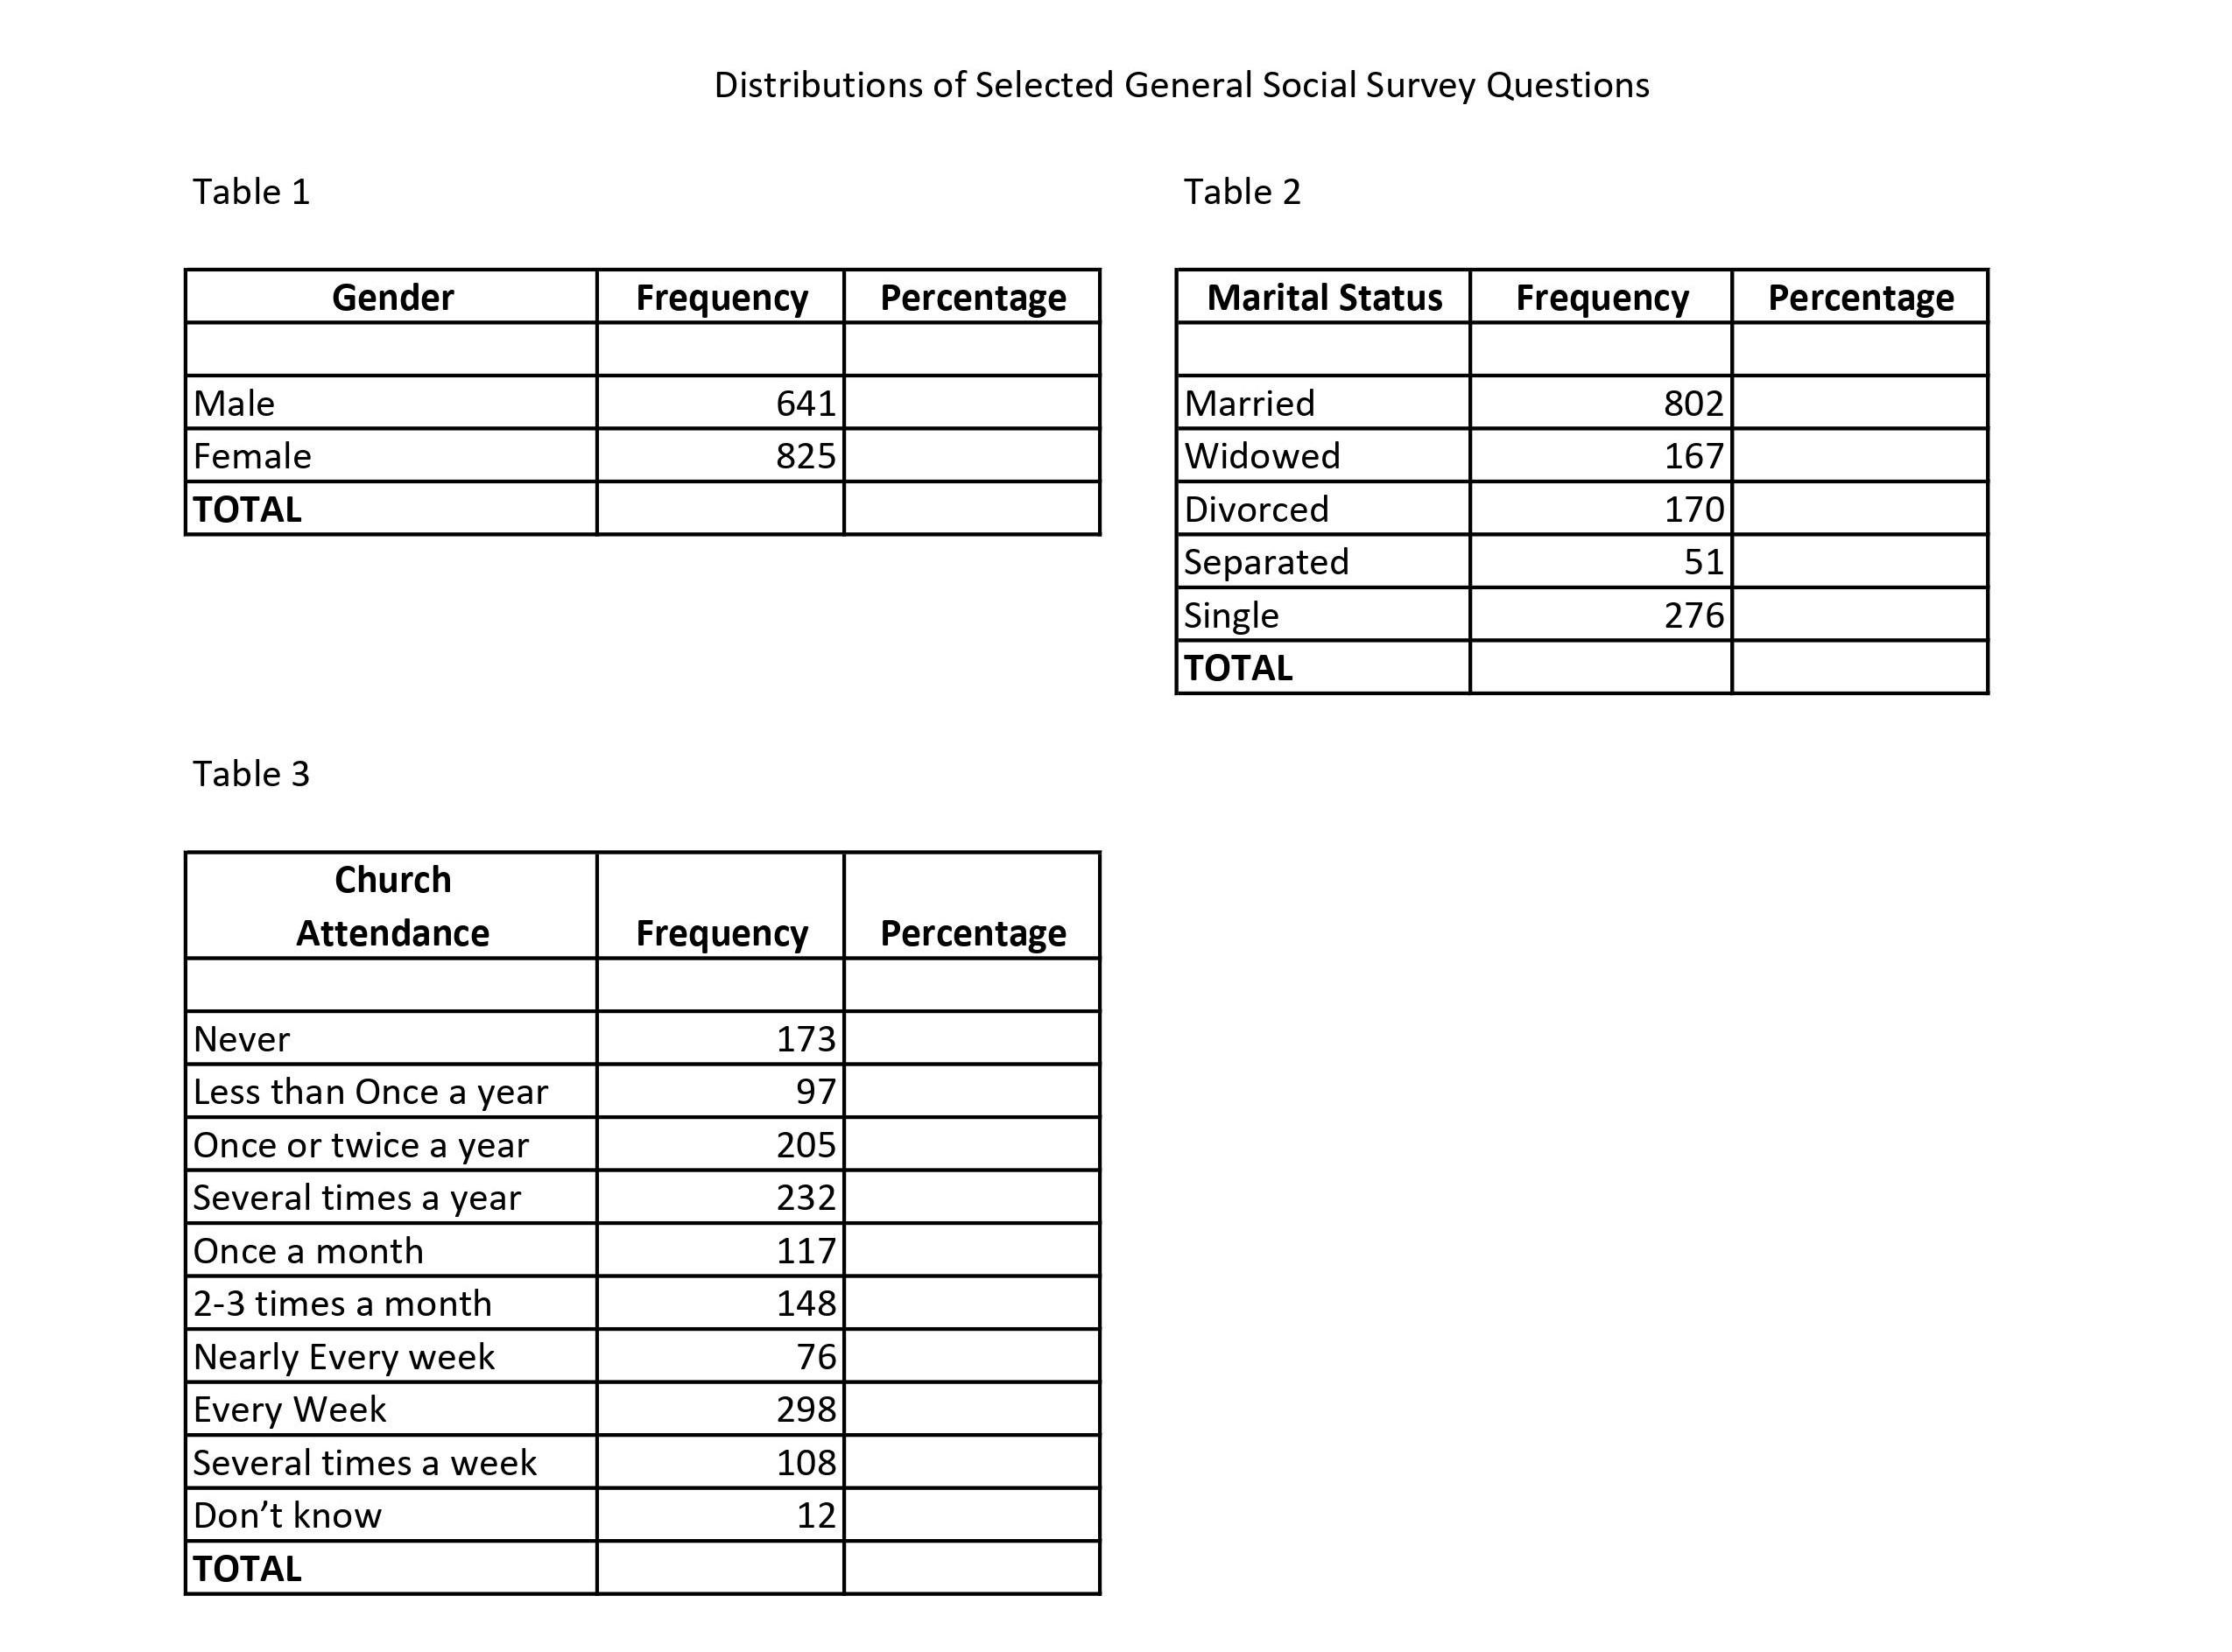
Calculate the total frequency in each table below. . Calculate the percentage in each category per table. Calculate the total percentage in each table. Cre.ate
Calculate the total frequency in each table below.
Calculate the percentage in each category per table.
Calculate the total percentage in each table.
Cre.ate a chart each table using the description and the percentage. (Ex. Male 2% Female 3%)
Please refer to the example out.put of the charts below
Calculate the percentage in each category per table.
Calculate the total percentage in each table.
Cre.ate a chart each table using the description and the percentage. (Ex. Male 2% Female 3%)
Please refer to the example out.put of the charts below

Table 1 Male Female TOTAL Table 3 Gender Church Attendance Never Less than Once a year Once or twice a year Several times a year Once a month 2-3 times month Nearly Every week Every Week Several times a week Don't know TOTAL Distributions of Selected General Social Survey Questions Frequency 641 825 Frequency 173 97 205 232 117 148 76 298 108 12 Percentage Percentage Table 2 Marital Status Frequency Married Widowed Divorced Separated Single TOTAL 802 167 170 51 276 Percentage
Step by Step Solution
★★★★★
3.44 Rating (154 Votes )
There are 3 Steps involved in it
Step: 1
To calculate the total frequency percentage in each category and total percentage in each table lets ...
Get Instant Access to Expert-Tailored Solutions
See step-by-step solutions with expert insights and AI powered tools for academic success
Step: 2

Step: 3

Ace Your Homework with AI
Get the answers you need in no time with our AI-driven, step-by-step assistance
Get Started


