Calculate the value of the FF
-test statistic.Numeric answers only. Do not include units. You may round your final answer to two decimal places.
What proportion of the variation in first year college GPA is explained by the linear relationship with first generation, high school GPA, social science credit hours, and humanities credit hours
Numeric answers only. Do not include units. You may round your final answer to two decimal places.
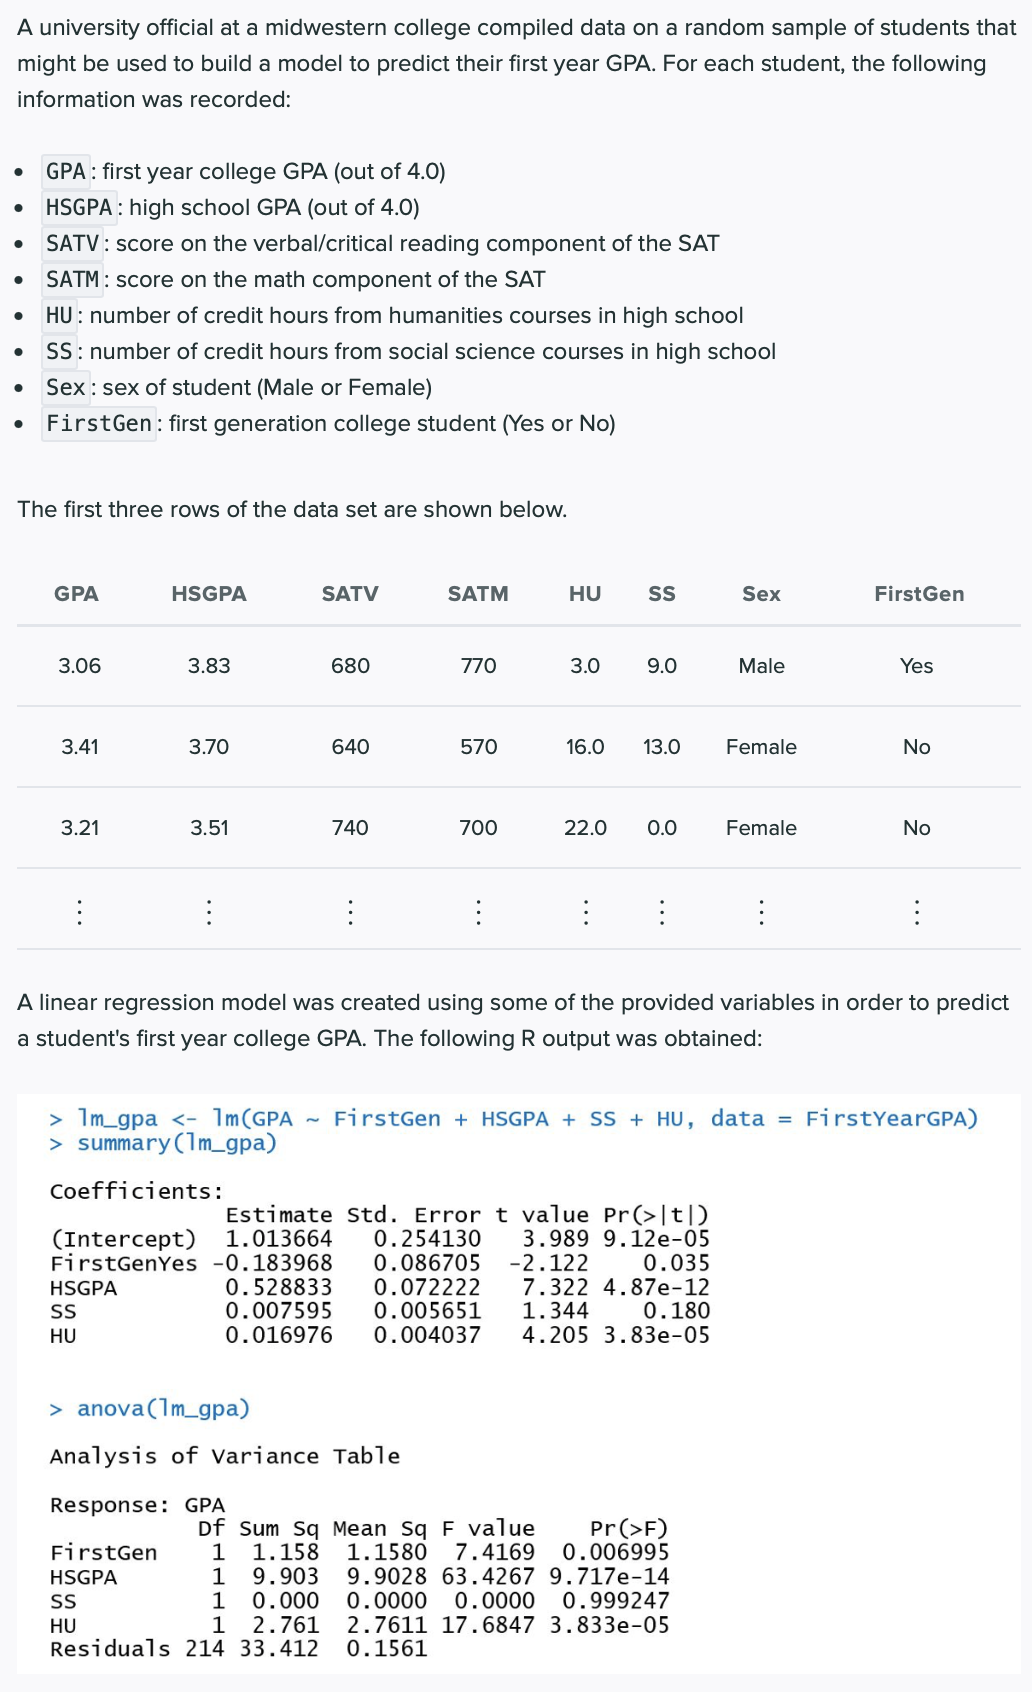
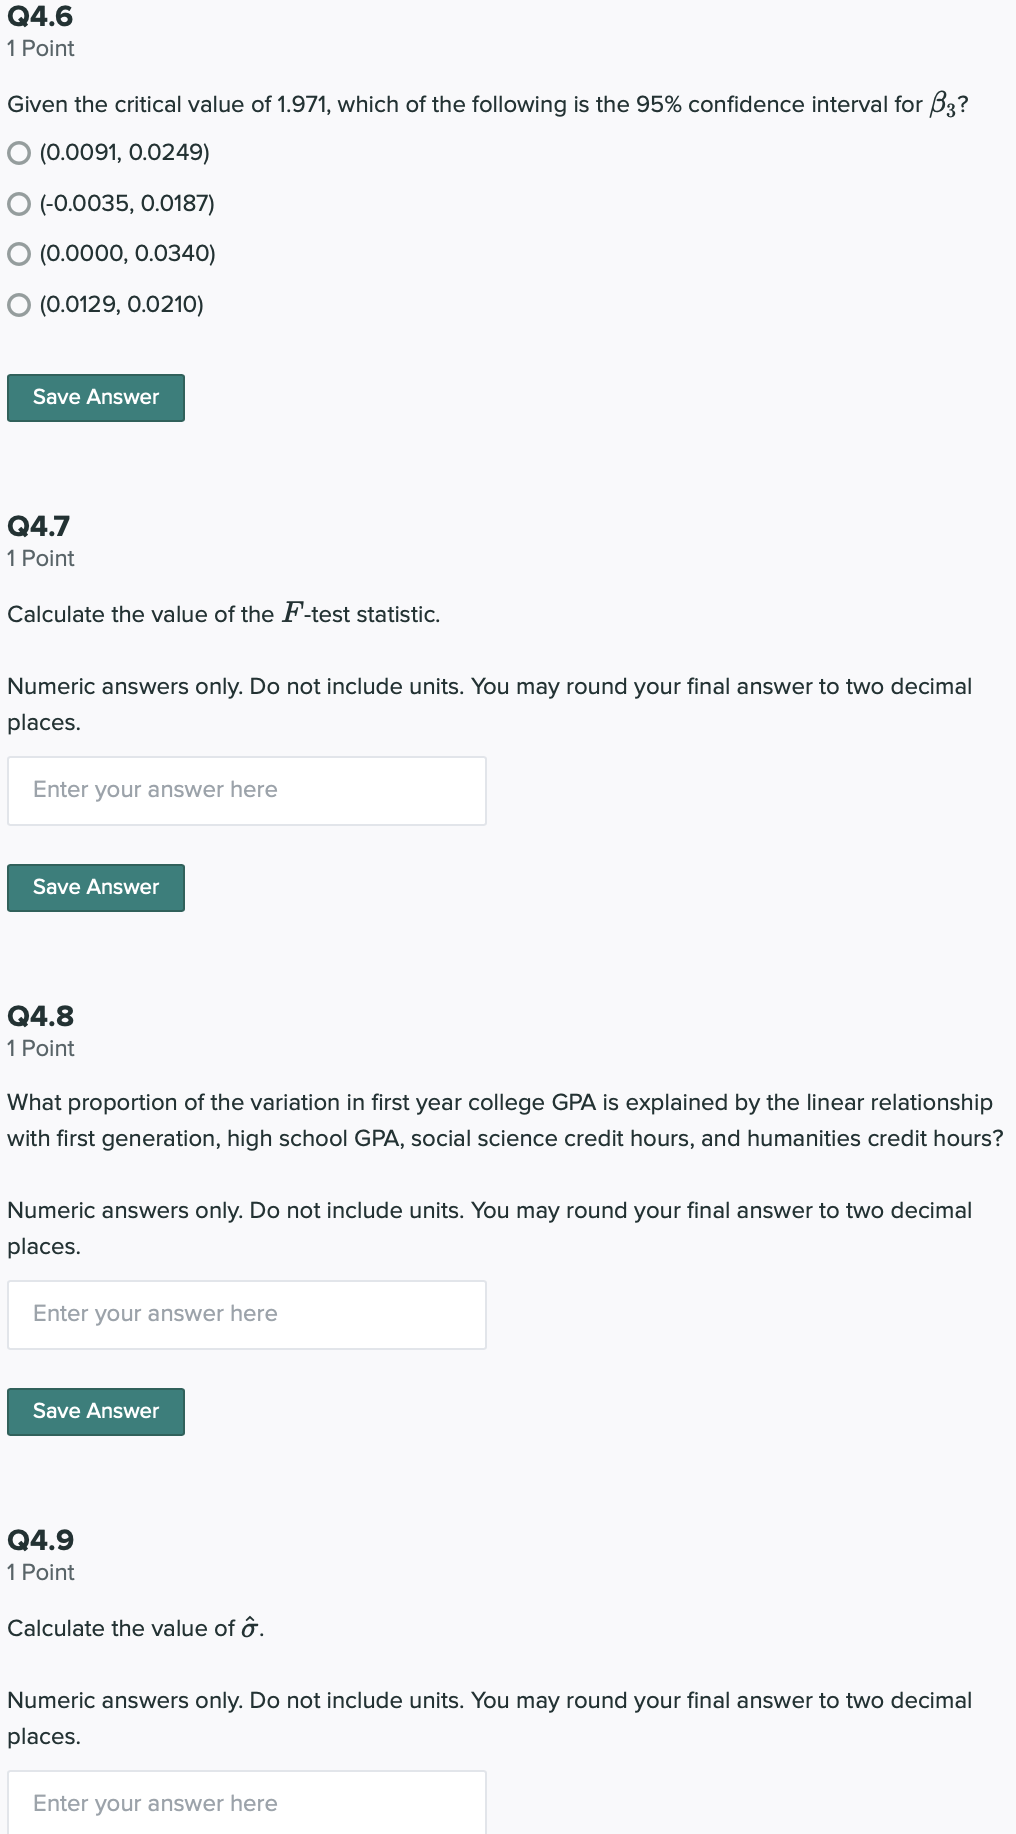
A university official at a midwestern college compiled data on a random sample of students that might be used to build a model to predict their first year GPA. For each student, the following information was recorded: GPA : first year college GPA (out of 4.0) HSGPA : high school GPA (out of 4.0) SATV : score on the verbal/critical reading component of the SAT SATM : score on the math component of the SAT HU : number of credit hours from humanities courses in high school SS : number of credit hours from social science courses in high school Sex : sex of student (Male or Female) FirstGen : first generation college student (Yes or No) The first three rows of the data set are shown below. GPA HSGPA SATV SATM HU SS Sex FirstGen 3.06 3.83 680 770 3.0 9.0 Male Yes 3.41 3.70 640 570 16.0 13.0 Female No 3.21 3.51 740 700 22.0 0.0 Female No . . . . . . . . . . . . . . . . . . . . . . . A linear regression model was created using some of the provided variables in order to predict a student's first year college GPA. The following R output was obtained: > Im_gpa summary (1m_gpa) Coefficients: Estimate Std. Error t value Pr(> |t|) (Intercept) 1. 013664 0. 254130 3. 989 9. 12e-05 FirstGenYes -0. 183968 0. 086705 -2. 122 0. 035 HSGPA 0. 528833 0. 072222 7. 322 4.87e-12 SS 0. 007595 0. 005651 1. 344 0. 180 HU 0. 016976 0. 004037 4.205 3.83e-05 > anova (1m_gpa) Analysis of Variance Table Response: GPA Df Sum Sq Mean Sq F value Pr (>F) FirstGen 1 1. 158 1. 1580 7. 4169 0. 006995 HSGPA 1 9. 903 9. 9028 63. 4267 9.717e-14 SS 1 0. 000 0. 0000 0. 0000 0. 999247 HU 1 2. 761 2.7611 17. 6847 3.833e-05 Residuals 214 33. 412 0. 1561Q4.6 1 Point Given the critical value of 1.971, which of the following is the 95% confidence interval for 83? O (0.0091, 0.0249) O (-0.0035, 0.0187) O (0.0000, 0.0340) O (0.0129, 0.0210) Save Answer Q4.7 1 Point Calculate the value of the F-test statistic. Numeric answers only. Do not include units. You may round your final answer to two decimal places. Enter your answer here Save Answer Q4.8 1 Point What proportion of the variation in first year college GPA is explained by the linear relationship with first generation, high school GPA, social science credit hours, and humanities credit hours? Numeric answers only. Do not include units. You may round your final answer to two decimal places. Enter your answer here Save Answer Q4.9 1 Point Calculate the value of o. Numeric answers only. Do not include units. You may round your final answer to two decimal places. Enter your answer here


