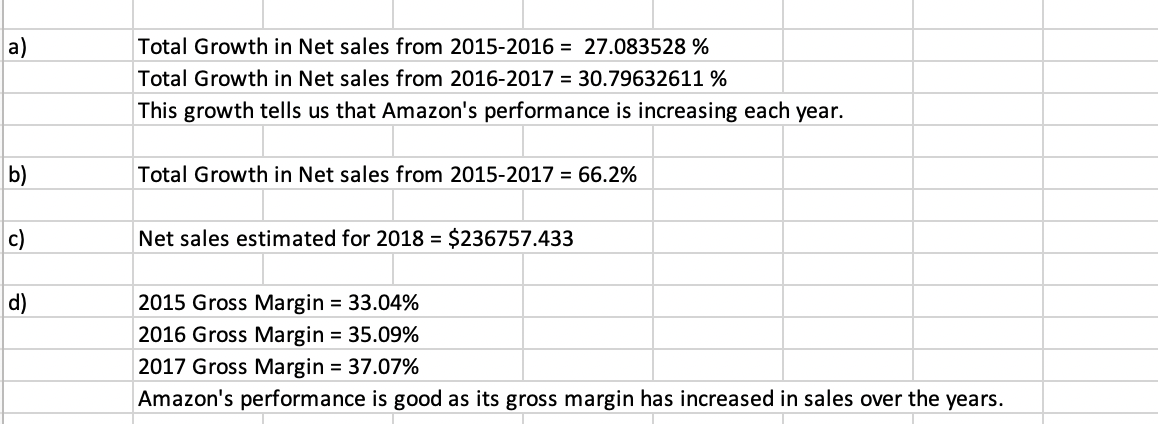
Calculate the various Profitability, Efficiency, and Market ratios for 2015, 2016 and 2017 where relevant. What do these ratios tell you about Amazons performance over the period. Comment on each ratio individually.
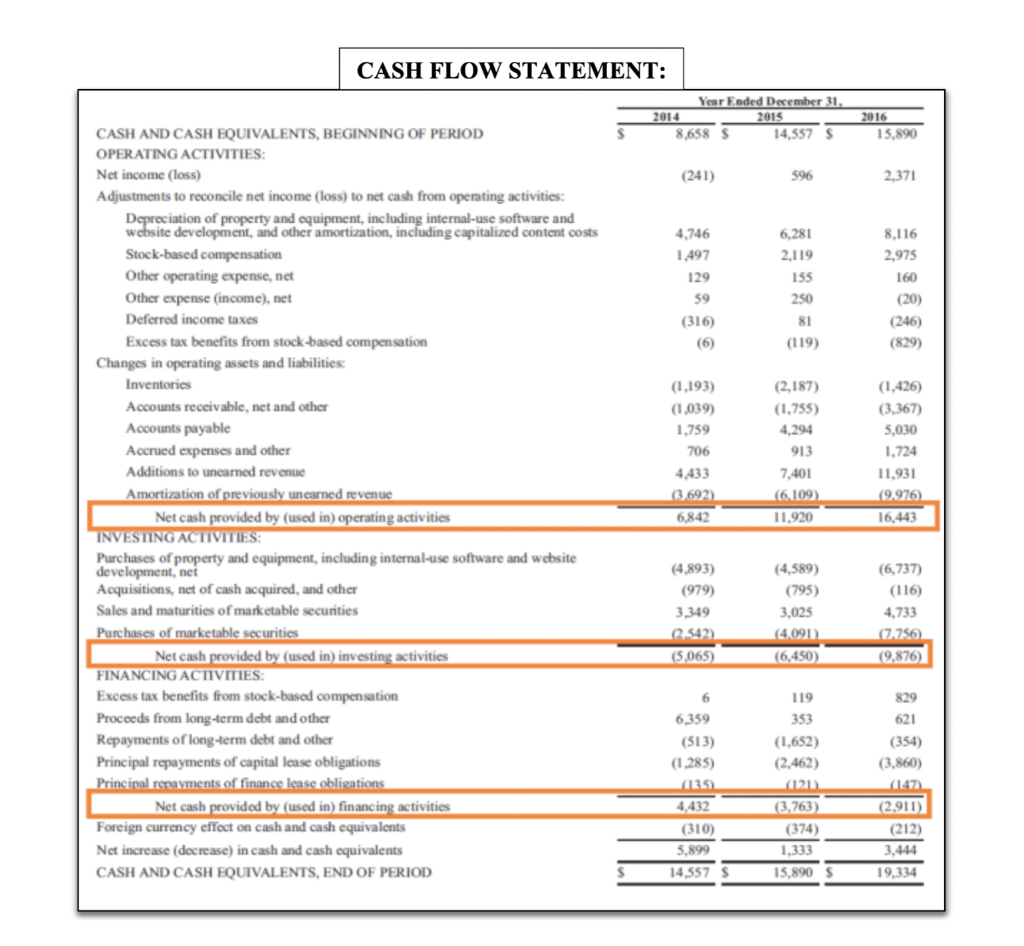
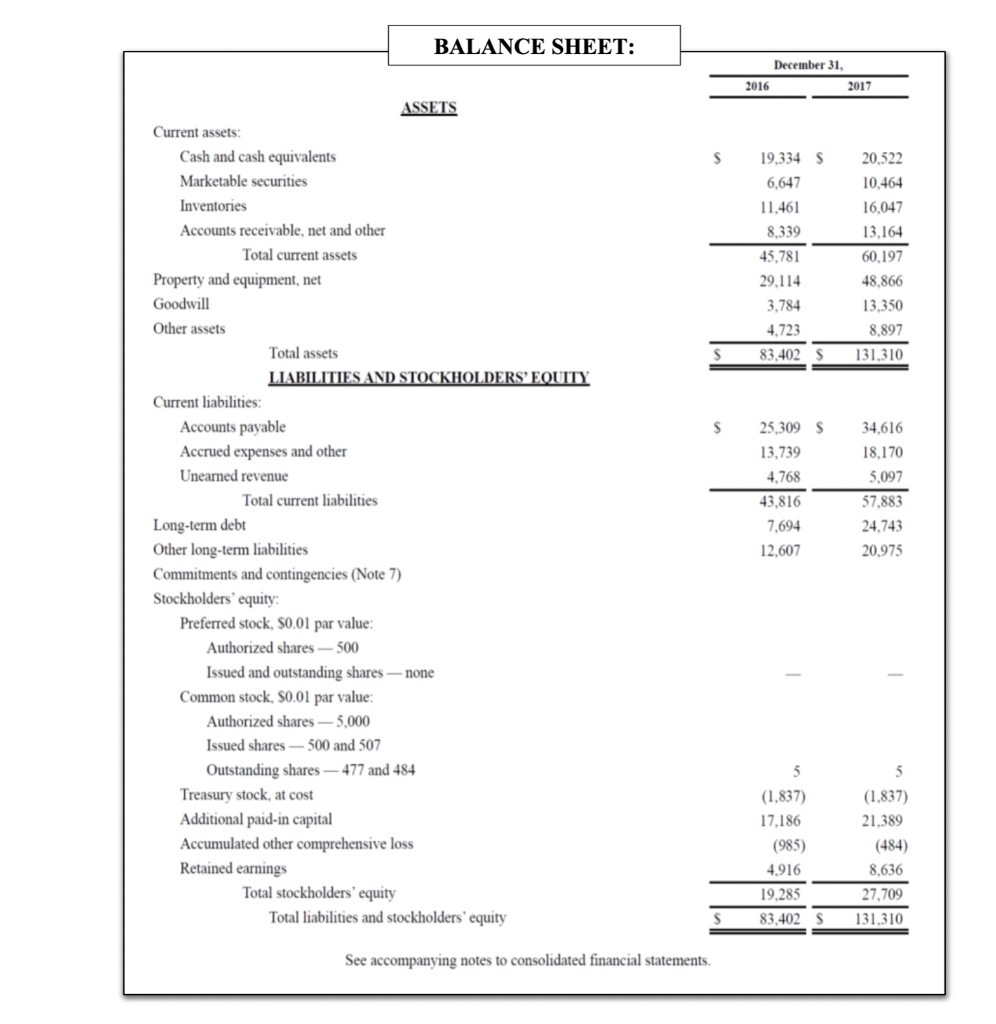
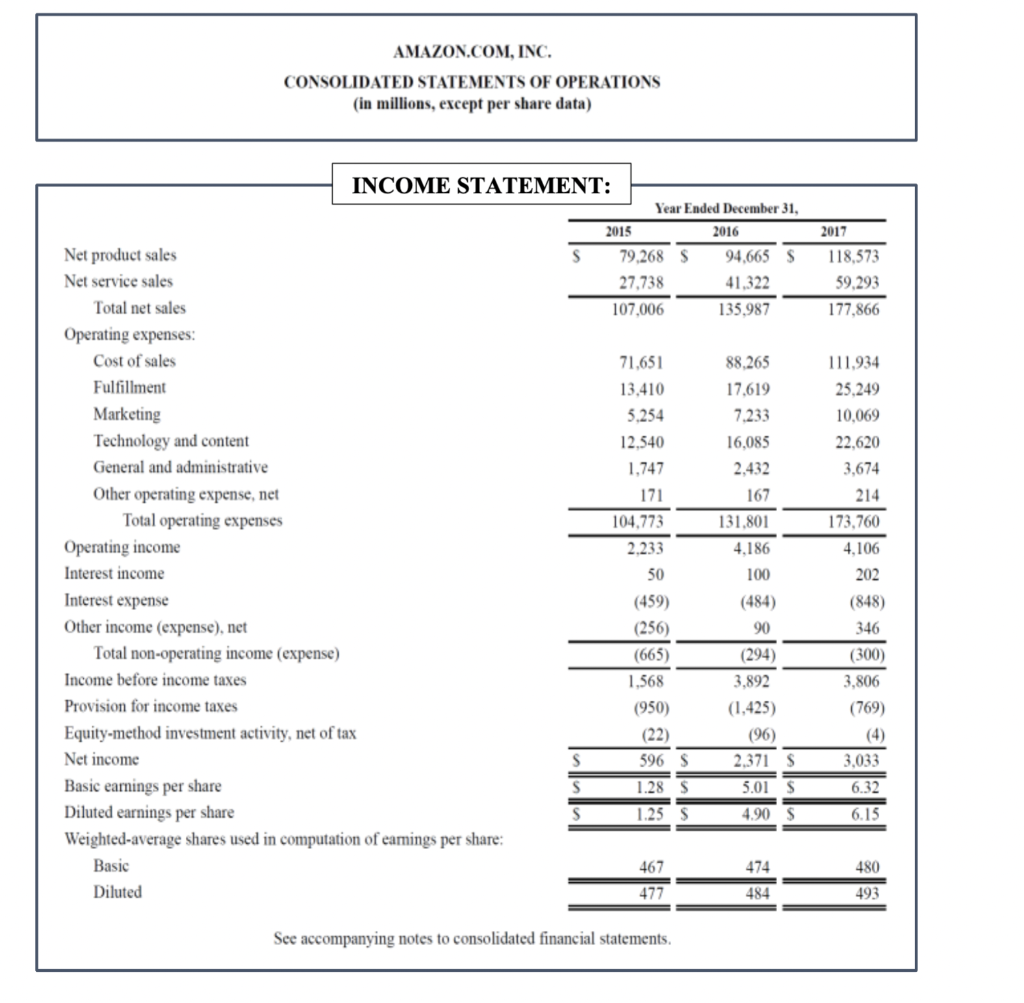
CASH FLOW STATEMENT: Year Ended December 31, 2014 2015 8,658 S 14,557 $ 2016 15.890 (241) 596 2,371 4,746 1.497 129 59 (316) 8,116 2.975 160 6,281 2,119 155 250 81 (119) (20) (246) (829) CASH AND CASH EQUIVALENTS, BEGINNING OF PERIOD OPERATING ACTIVITIES: Net income (loss) Adjustments to reconcile net income (loss) to net cash from operating activities: Depreciation of property and equipment, including internal-use software and website development, and other amortization, including capitalized content costs Stock-based compensation Other operating expense, net Other expense (income), net Deferred income taxes Excess tax benefits from stock-based compensation Changes in operating assets and liabilities Inventories Accounts receivable, net and other Accounts payable Accrued expenses and other Additions to unearned revenue Amortization of previously unearned revenue Net cash provided by (used in) operating activities INVESTING ACTIVITIES: Purchases of property and equipment, including internal-use software and website development, net Acquisitions, net of cash acquired, and other Sales and maturities of marketable securities Purchases of marketable securities Net cash provided by (used in) investing activities FINANCING ACTIVITIES: Excess tax benefits from stock-based compensation Proceeds from long-term debt and other Repayments of long-term debt and other Principal repayments of capital lease obligations Principal repayments of finance lease obligations Net cash provided by (used in) financing activities Foreign currency effect on cash and cash equivalents Net increase (decrease) in cash and cash equivalents CASH AND CASH EQUIVALENTS, END OF PERIOD (1.193) (1,039) 1,759 706 4.433 13.692) (2,187) (1,755) 4.294 913 7,401 (6 109) 11.920 (1,426) (3,367) 5,030 1.724 11.931 (9.976 16,443 6,842 (4.893) (979) 3.349 0.542) (5,065) (4,589) (795) 3,025 (4.091) (6.450) (6,737) (116) 4,733 (72756 (9,876) 829 621 6 6.359 (513) (1,285) 035 4,432 (310) 5,899 14,557 S 119 353 (1.652) (2,462) (121) (3,763) (374) 1.333 (354) (3.860) (147 (2,911) (212) 3,444 19,334 15.890 S BALANCE SHEET: December 31, 2016 2017 s 19,334 S 6,647 11.461 8,339 45,781 29,114 3,784 20.522 10,464 16,047 13,164 60,197 48.866 13,350 8,897 131.310 4,723 83,402 S s ASSETS Current assets: Cash and cash equivalents Marketable securities Inventories Accounts receivable, net and other Total current assets Property and equipment, net Goodwill Other assets Total assets LIABILITIES AND STOCKHOLDERS' EQUITY Current liabilities: Accounts payable Accrued expenses and other Unearned revenue Total current liabilities Long-term debt Other long-term liabilities Commitments and contingencies (Note 7) Stockholders' equity Preferred stock, S0.01 par value: Authorized shares - 500 Issued and outstanding shares - none Common stock, 30.01 par value: Authorized shares - 5,000 Issued shares - 500 and 507 Outstanding shares 477 and 484 Treasury stock, at cost Additional paid-in capital Accumulated other comprehensive loss Retained earnings Total stockholders' equity Total liabilities and stockholders' equity 25,309 s 13,739 4,768 43.816 7,694 12,607 34,616 18.170 5,097 57,883 24,743 20.975 5 (1.837) 17,186 (985) 4,916 19,285 83,402 S (1.837) 21,389 (484) 8,636 27,709 131,310 See accompanying notes to consolidated financial statements. AMAZON.COM, INC. CONSOLIDATED STATEMENTS OF OPERATIONS (in millions, except per share data) 2017 118,573 59.293 177.866 INCOME STATEMENT: Year Ended December 31, 2015 2016 Net product sales S 79.268 $ 94,665 $ Net service sales 27,738 41.322 Total net sales 107,006 135,987 Operating expenses: Cost of sales 71,651 88.265 Fulfillment 13.410 17.619 Marketing 5.254 7.233 Technology and content 12.540 16,085 General and administrative 1,747 2.432 Other operating expense, net 171 167 Total operating expenses 104.773 131.801 Operating income 2.233 4,186 Interest income 50 100 Interest expense (459) (484) Other income (expense), net (256) 90 Total non-operating income (expense) (665) (294) Income before income taxes 1.568 3,892 Provision for income taxes (950) (1,425) Equity-method investment activity, net of tax (22) (96) Net income S 596 S 2.371 S Basic earnings per share 1.28 $ 5.01$ Diluted earnings per share 1.25 S 4.90 S Weighted average shares used in computation of eamings per share: Basic 467 474 Diluted 477 484 111.934 25,249 10,069 22,620 3,674 214 173,760 4.106 202 (848) 346 (300) 3,806 (769) (4) 3,033 6.32 6.15 480 493 See accompanying notes to consolidated financial statements. a) Total Growth in Net sales from 2015-2016 = 27.083528 % Total Growth in Net sales from 2016-2017 = 30.79632611 % This growth tells us that Amazon's performance is increasing each year. b) Total Growth in Net sales from 2015-2017 = 66.2% c) Net sales estimated for 2018 = $236757.433 d) 2015 Gross Margin = 33.04% 2016 Gross Margin = 35.09% 2017 Gross Margin = 37.07% Amazon's performance is good as its gross margin has increased in sales over the years. CASH FLOW STATEMENT: Year Ended December 31, 2014 2015 8,658 S 14,557 $ 2016 15.890 (241) 596 2,371 4,746 1.497 129 59 (316) 8,116 2.975 160 6,281 2,119 155 250 81 (119) (20) (246) (829) CASH AND CASH EQUIVALENTS, BEGINNING OF PERIOD OPERATING ACTIVITIES: Net income (loss) Adjustments to reconcile net income (loss) to net cash from operating activities: Depreciation of property and equipment, including internal-use software and website development, and other amortization, including capitalized content costs Stock-based compensation Other operating expense, net Other expense (income), net Deferred income taxes Excess tax benefits from stock-based compensation Changes in operating assets and liabilities Inventories Accounts receivable, net and other Accounts payable Accrued expenses and other Additions to unearned revenue Amortization of previously unearned revenue Net cash provided by (used in) operating activities INVESTING ACTIVITIES: Purchases of property and equipment, including internal-use software and website development, net Acquisitions, net of cash acquired, and other Sales and maturities of marketable securities Purchases of marketable securities Net cash provided by (used in) investing activities FINANCING ACTIVITIES: Excess tax benefits from stock-based compensation Proceeds from long-term debt and other Repayments of long-term debt and other Principal repayments of capital lease obligations Principal repayments of finance lease obligations Net cash provided by (used in) financing activities Foreign currency effect on cash and cash equivalents Net increase (decrease) in cash and cash equivalents CASH AND CASH EQUIVALENTS, END OF PERIOD (1.193) (1,039) 1,759 706 4.433 13.692) (2,187) (1,755) 4.294 913 7,401 (6 109) 11.920 (1,426) (3,367) 5,030 1.724 11.931 (9.976 16,443 6,842 (4.893) (979) 3.349 0.542) (5,065) (4,589) (795) 3,025 (4.091) (6.450) (6,737) (116) 4,733 (72756 (9,876) 829 621 6 6.359 (513) (1,285) 035 4,432 (310) 5,899 14,557 S 119 353 (1.652) (2,462) (121) (3,763) (374) 1.333 (354) (3.860) (147 (2,911) (212) 3,444 19,334 15.890 S BALANCE SHEET: December 31, 2016 2017 s 19,334 S 6,647 11.461 8,339 45,781 29,114 3,784 20.522 10,464 16,047 13,164 60,197 48.866 13,350 8,897 131.310 4,723 83,402 S s ASSETS Current assets: Cash and cash equivalents Marketable securities Inventories Accounts receivable, net and other Total current assets Property and equipment, net Goodwill Other assets Total assets LIABILITIES AND STOCKHOLDERS' EQUITY Current liabilities: Accounts payable Accrued expenses and other Unearned revenue Total current liabilities Long-term debt Other long-term liabilities Commitments and contingencies (Note 7) Stockholders' equity Preferred stock, S0.01 par value: Authorized shares - 500 Issued and outstanding shares - none Common stock, 30.01 par value: Authorized shares - 5,000 Issued shares - 500 and 507 Outstanding shares 477 and 484 Treasury stock, at cost Additional paid-in capital Accumulated other comprehensive loss Retained earnings Total stockholders' equity Total liabilities and stockholders' equity 25,309 s 13,739 4,768 43.816 7,694 12,607 34,616 18.170 5,097 57,883 24,743 20.975 5 (1.837) 17,186 (985) 4,916 19,285 83,402 S (1.837) 21,389 (484) 8,636 27,709 131,310 See accompanying notes to consolidated financial statements. AMAZON.COM, INC. CONSOLIDATED STATEMENTS OF OPERATIONS (in millions, except per share data) 2017 118,573 59.293 177.866 INCOME STATEMENT: Year Ended December 31, 2015 2016 Net product sales S 79.268 $ 94,665 $ Net service sales 27,738 41.322 Total net sales 107,006 135,987 Operating expenses: Cost of sales 71,651 88.265 Fulfillment 13.410 17.619 Marketing 5.254 7.233 Technology and content 12.540 16,085 General and administrative 1,747 2.432 Other operating expense, net 171 167 Total operating expenses 104.773 131.801 Operating income 2.233 4,186 Interest income 50 100 Interest expense (459) (484) Other income (expense), net (256) 90 Total non-operating income (expense) (665) (294) Income before income taxes 1.568 3,892 Provision for income taxes (950) (1,425) Equity-method investment activity, net of tax (22) (96) Net income S 596 S 2.371 S Basic earnings per share 1.28 $ 5.01$ Diluted earnings per share 1.25 S 4.90 S Weighted average shares used in computation of eamings per share: Basic 467 474 Diluted 477 484 111.934 25,249 10,069 22,620 3,674 214 173,760 4.106 202 (848) 346 (300) 3,806 (769) (4) 3,033 6.32 6.15 480 493 See accompanying notes to consolidated financial statements. a) Total Growth in Net sales from 2015-2016 = 27.083528 % Total Growth in Net sales from 2016-2017 = 30.79632611 % This growth tells us that Amazon's performance is increasing each year. b) Total Growth in Net sales from 2015-2017 = 66.2% c) Net sales estimated for 2018 = $236757.433 d) 2015 Gross Margin = 33.04% 2016 Gross Margin = 35.09% 2017 Gross Margin = 37.07% Amazon's performance is good as its gross margin has increased in sales over the years