Question
Calculate the WACC for the company with the info below: use the best info and the most relevant to the problem: -the company finance its
Calculate the WACC for the company with the info below: use the best info and the most relevant to the problem:
-the company finance its assets which cost over $200 billion.
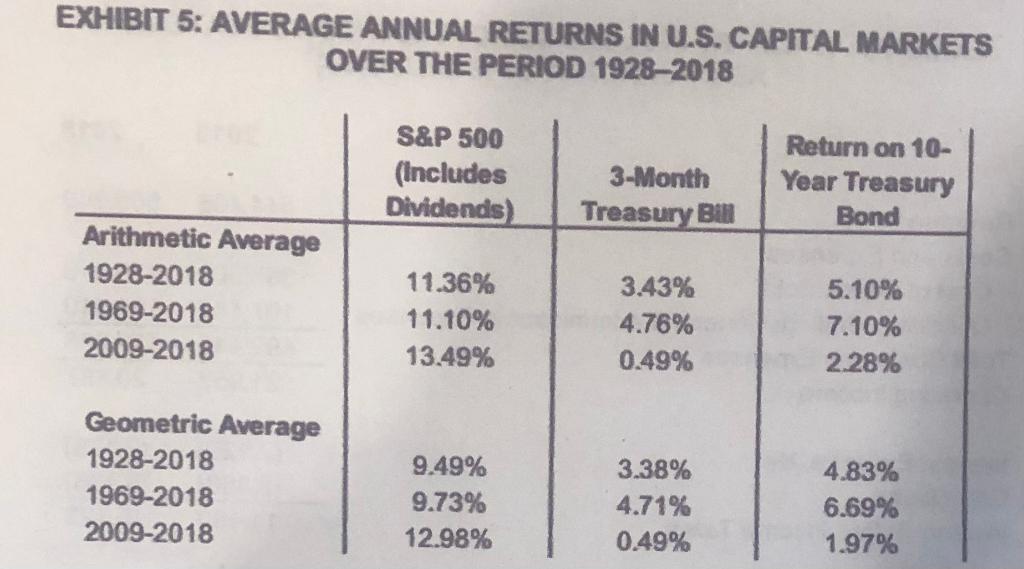
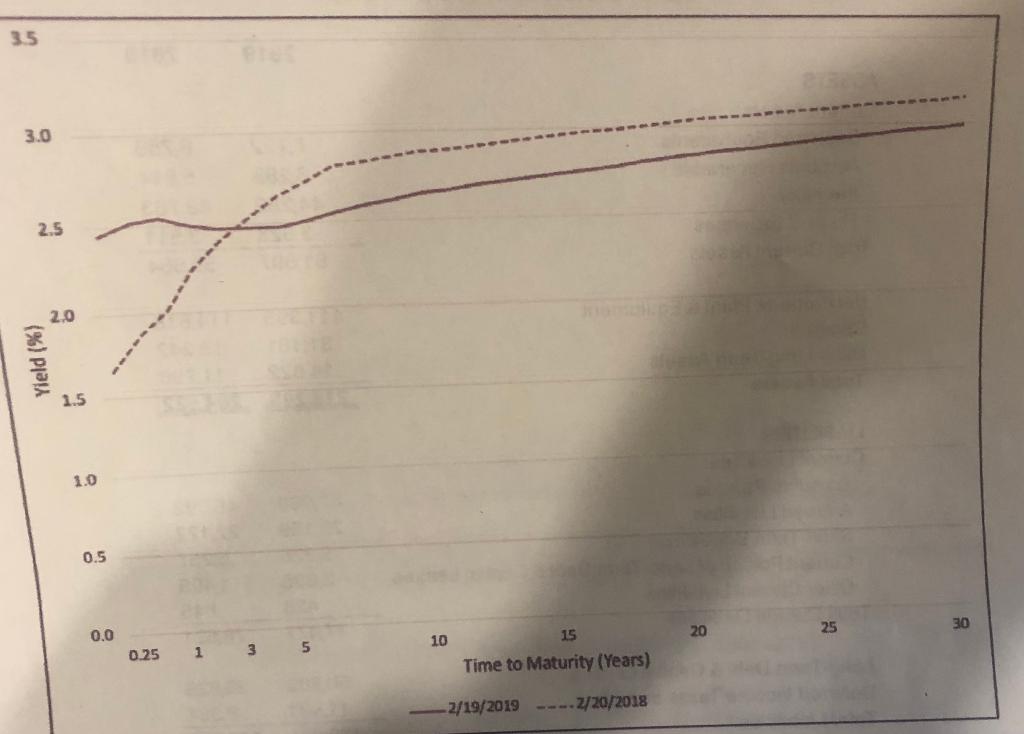
-The US department of treasury website that the three month treasury bill were yielding 2.45% while 1, 5 and 10 year treasury bonds were yielding 2.54% and 2.47% and 2.65% respectively.
- other interest rates were found the prime rate is 5.5% and 3 month commercial paper was averaging 2.73%.
-The company issued a lot of bonds on February 15th 2000 it issued 1 billion in bonds with coupon rates of 7.55% the bonds mature on February 15 2030 around 11 years from now the bonds were selling for 136.38 in yielding 3.53% today.
- the company has no preferred shares currently and does not look like it's gonna issue any in the foreseeable future.
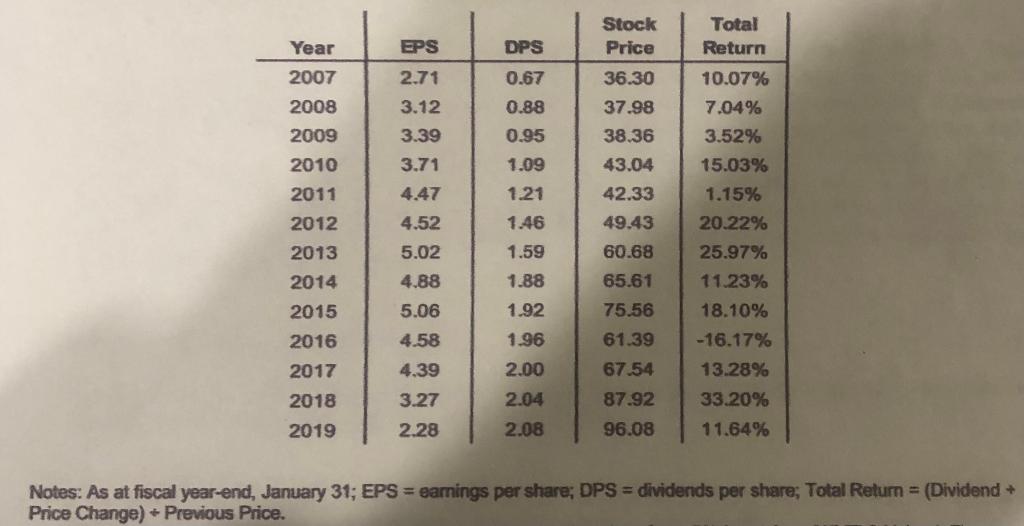
- over the past year, shareholders received $2.08 per share in dividend the stock was recently trading for $102.2.
- the company recorded $2.26 in unadjusted earnings per share but $4.91 in adjusted earnings per share
- the company's return on equity is to be 8.9% as the fiscal year ending January 31st 2019 for 2018 2017 in 2016 it was 12.7, 17.2, and 18.1% respectively
- the company's "raw" data was 0.56 it was based on a regression of two years of weekly data
- there was also an adjusted beta of 0.71 according to some analysts the ad hoc adjustment 0.67 times the raw beta plus 0.33 always makes the adjusted beta closer to the markets beta of 1 this is because of the assumption that security betas tends to move towards the market average overtime.
- in the business news the corporate tax rates are now lower than in the recent past due to some new US tax regulation it is now 21% but a recent press release the company quarterly returned says that the company's anticipating an effective tax rate of 27%.
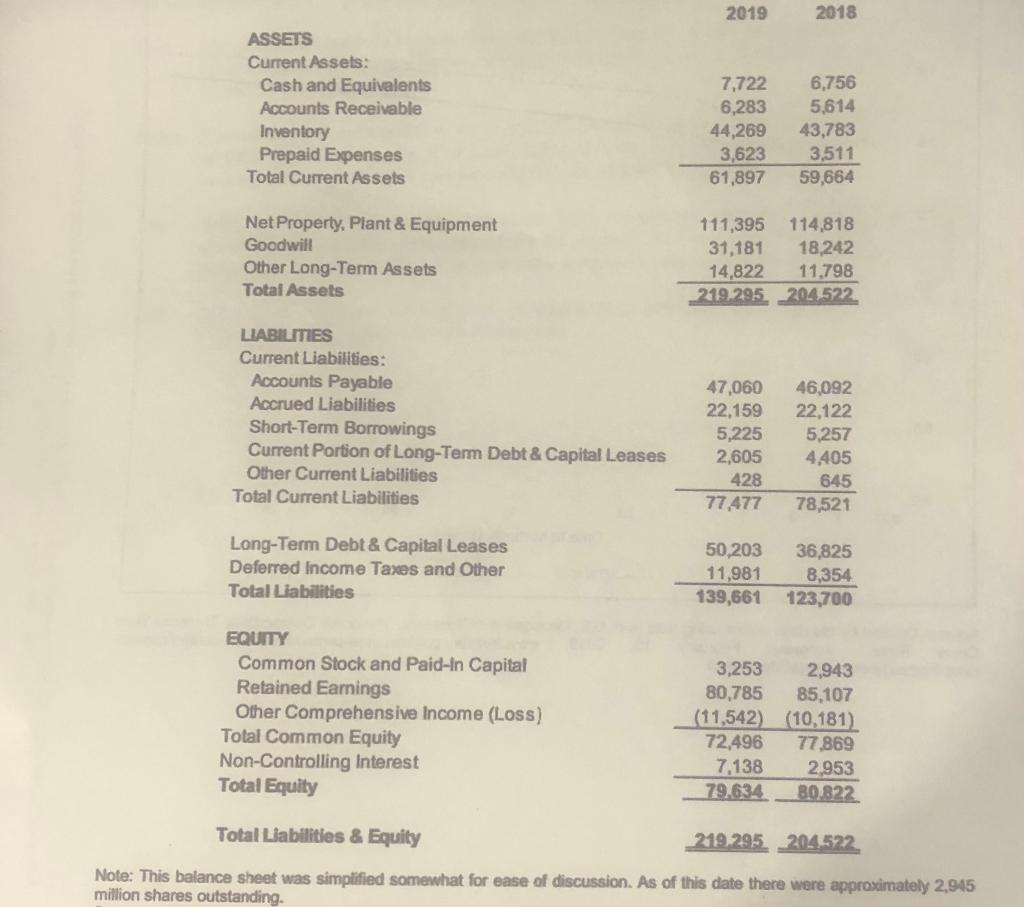
- as of jan 31 2019 e are approximately 2,945 million shares outstanding
Balance sheet ,income statement all as of jan 31 2019 in millions 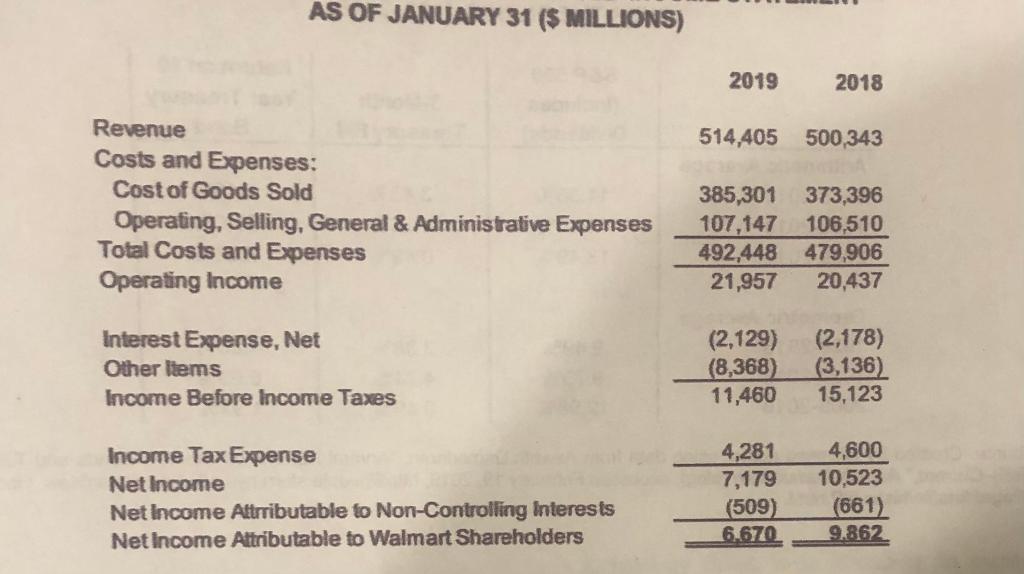
 c
c
Step by Step Solution
There are 3 Steps involved in it
Step: 1

Get Instant Access to Expert-Tailored Solutions
See step-by-step solutions with expert insights and AI powered tools for academic success
Step: 2

Step: 3

Ace Your Homework with AI
Get the answers you need in no time with our AI-driven, step-by-step assistance
Get Started


