Calculate TJX's inventory turnover for 2019 (round to tenths). And calculate TJX's average days to sell inventory for 2019 (round to tenths). The TJX Companies,
Calculate TJX's inventory turnover for 2019 (round to tenths). And calculate TJX's average days to sell inventory for 2019 (round to tenths).
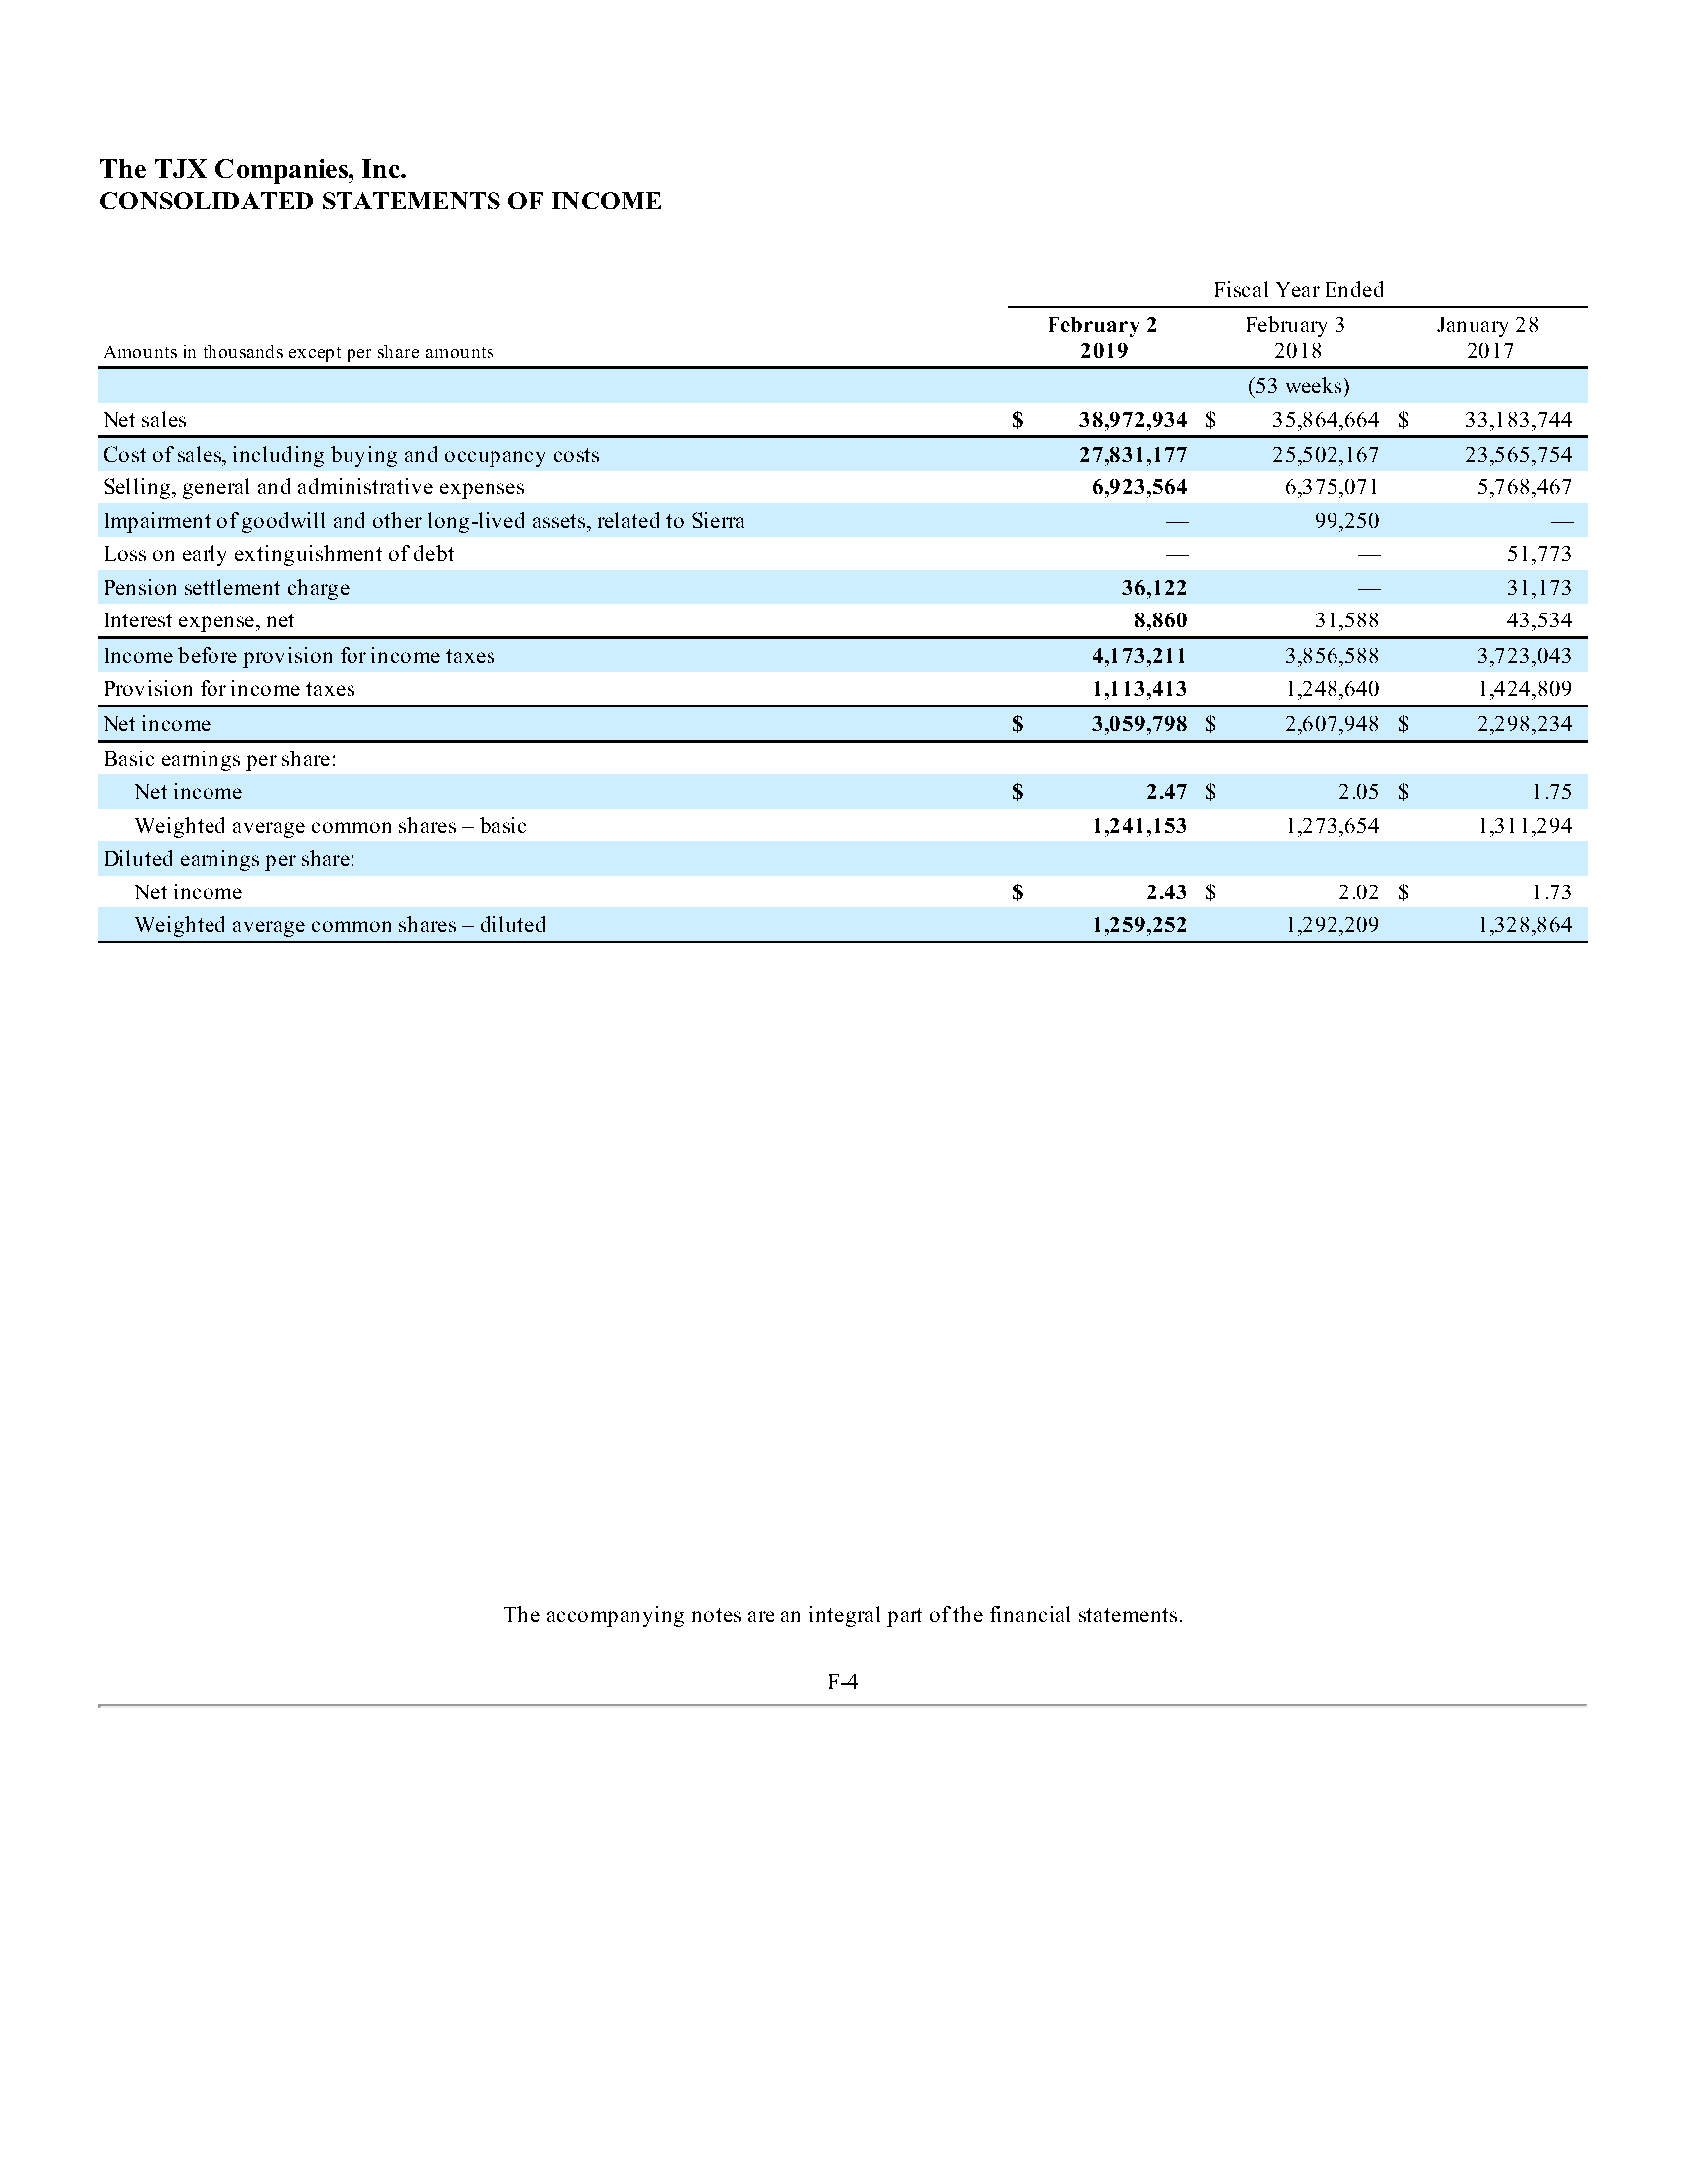
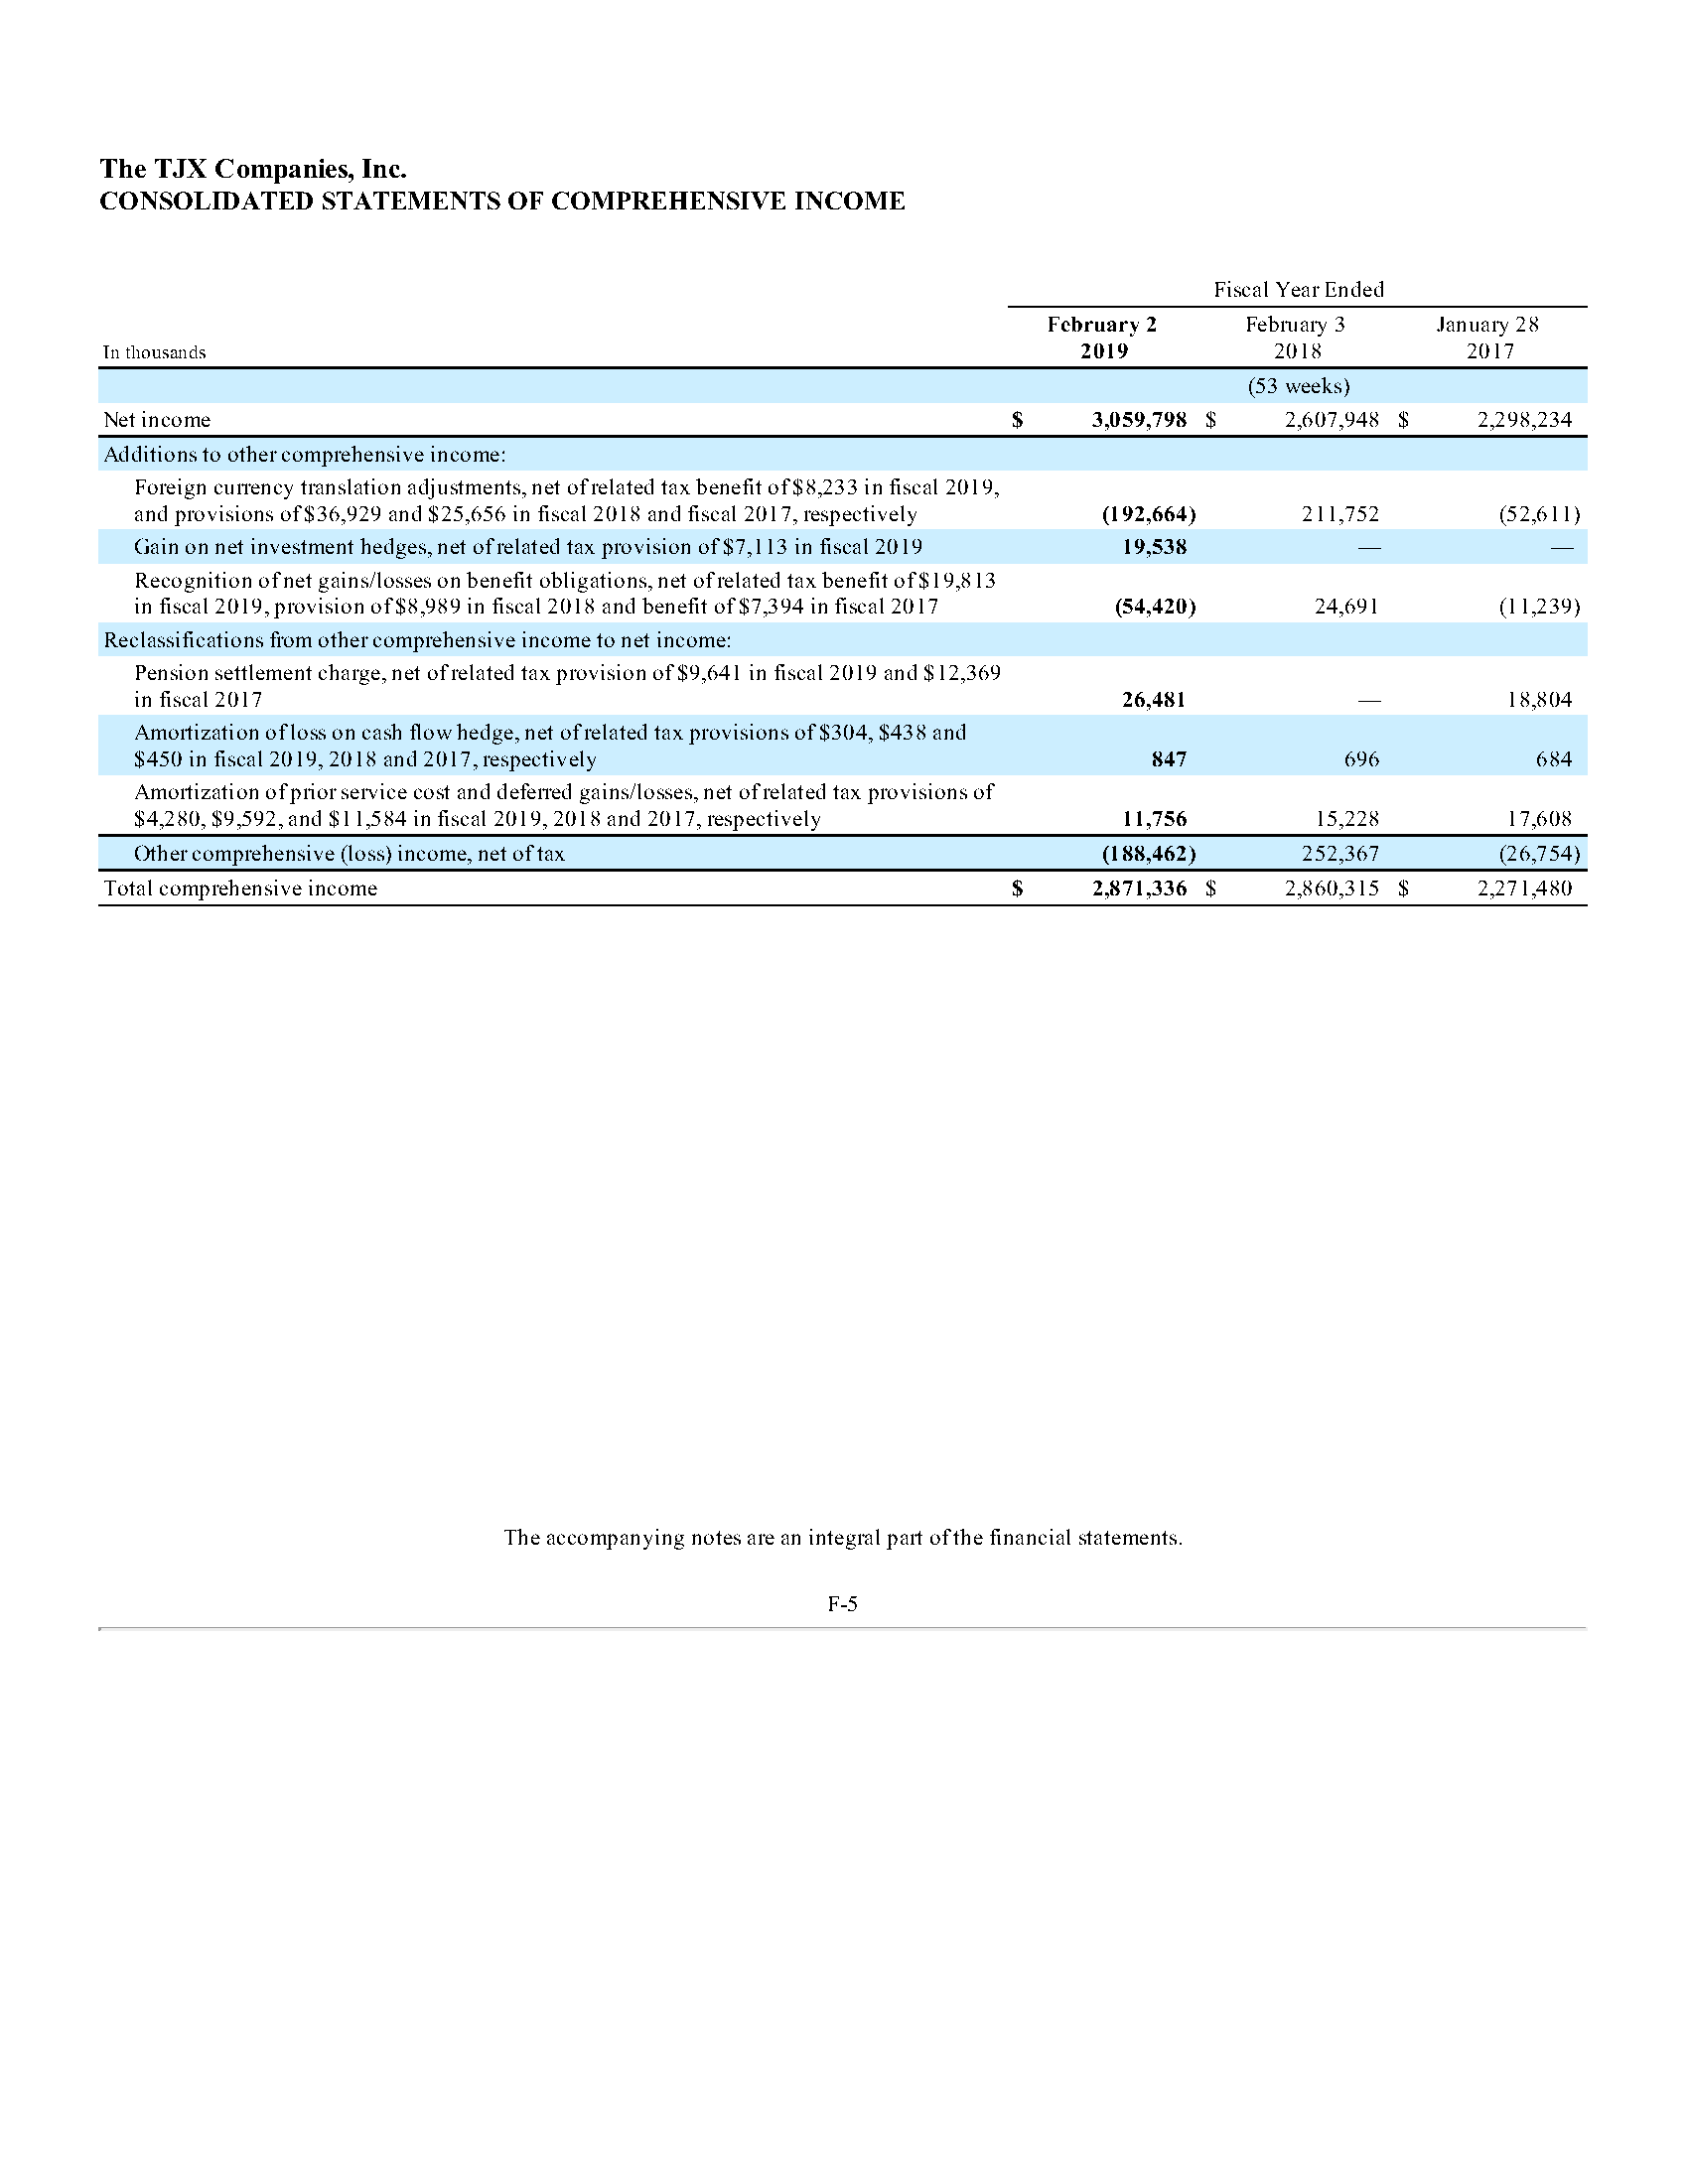
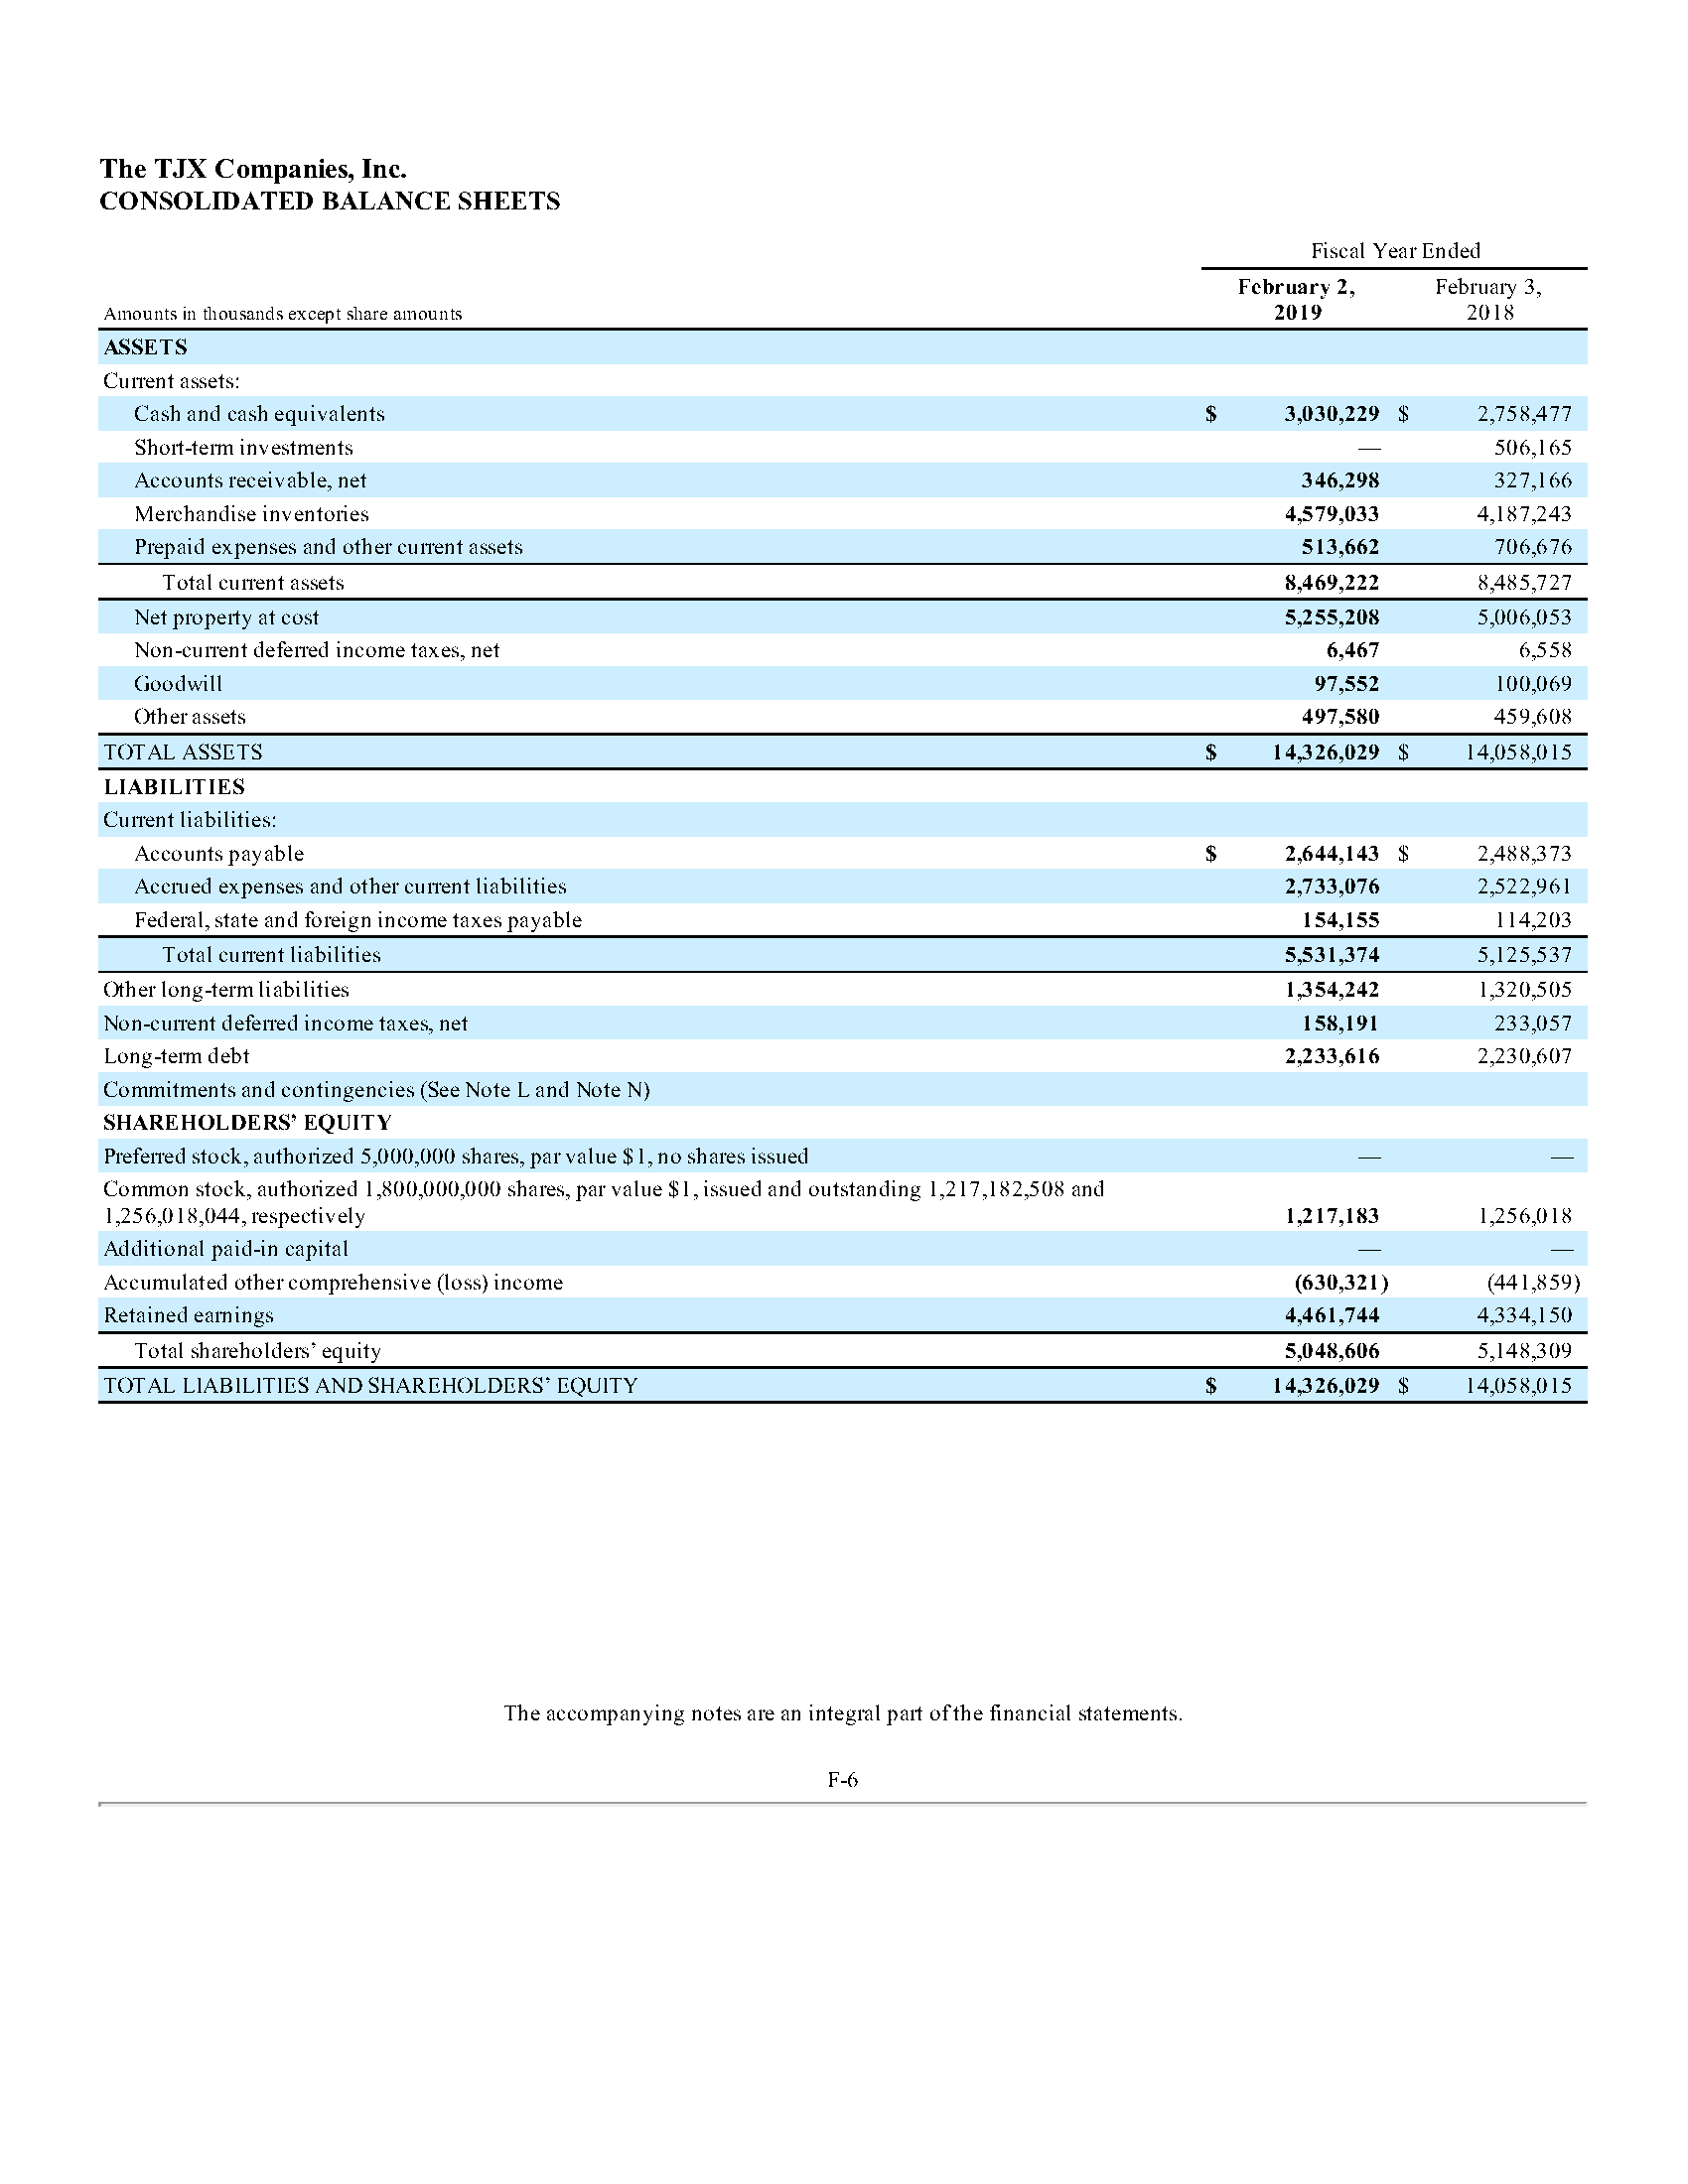
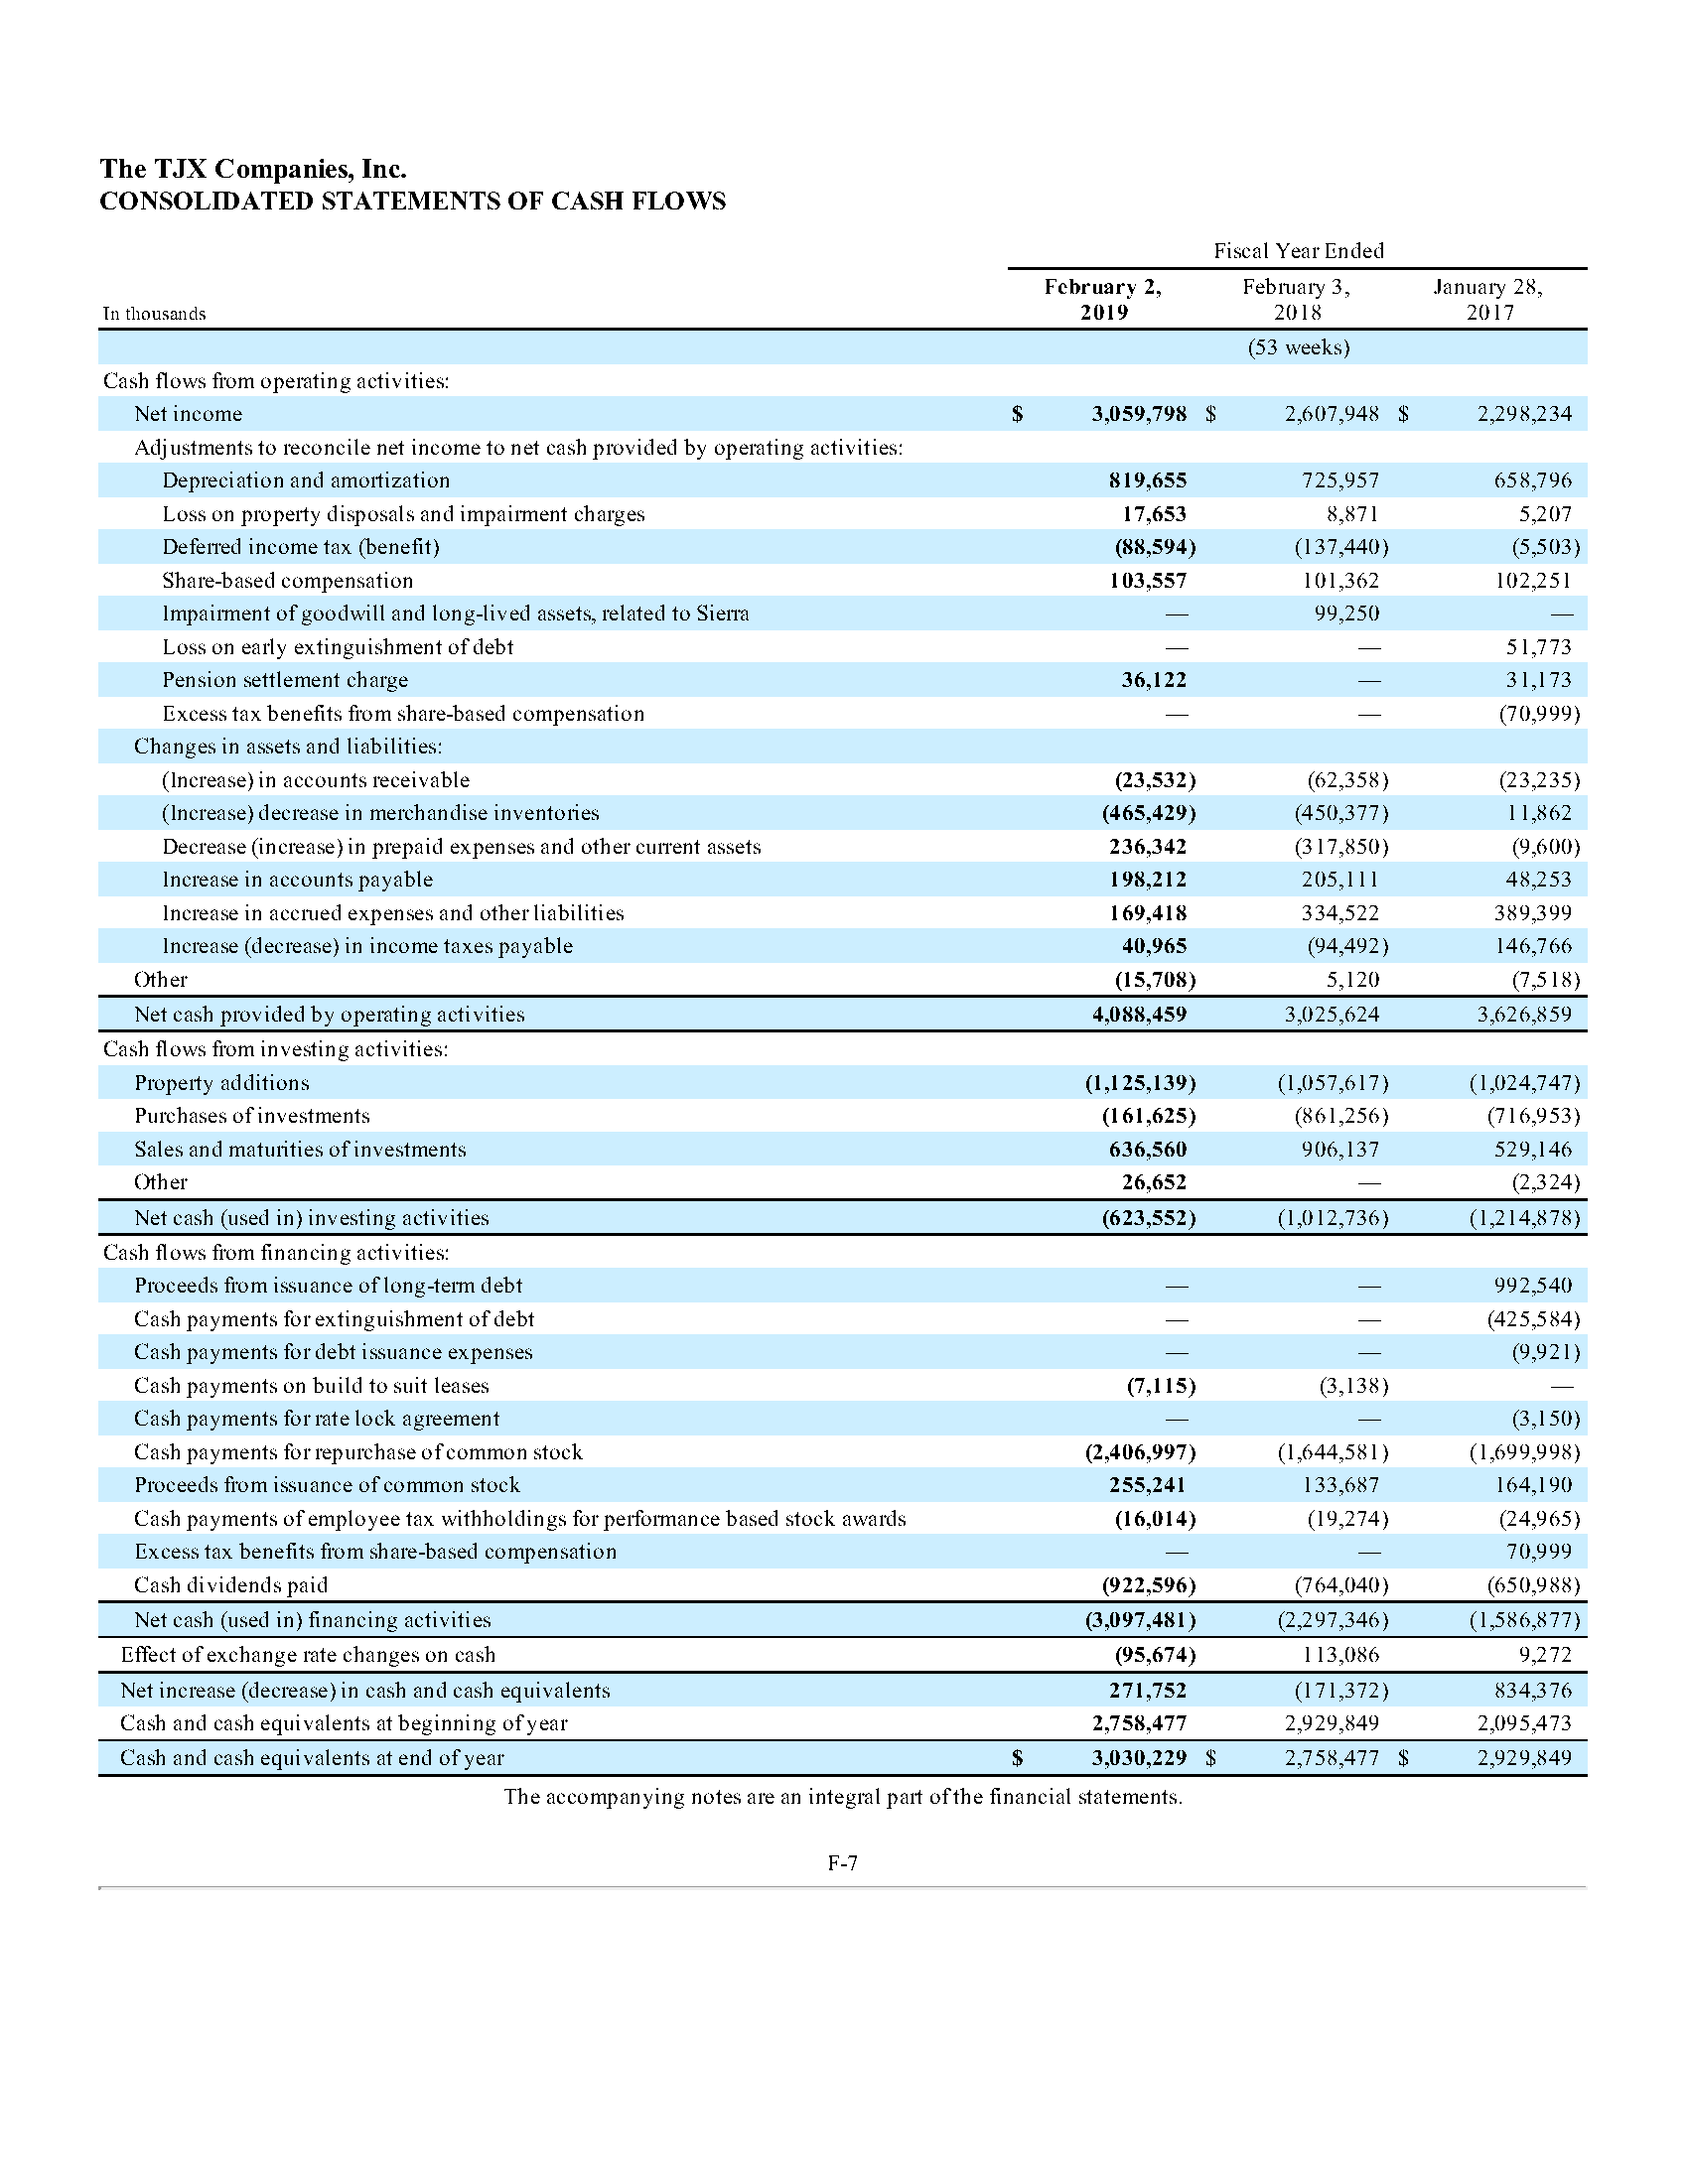
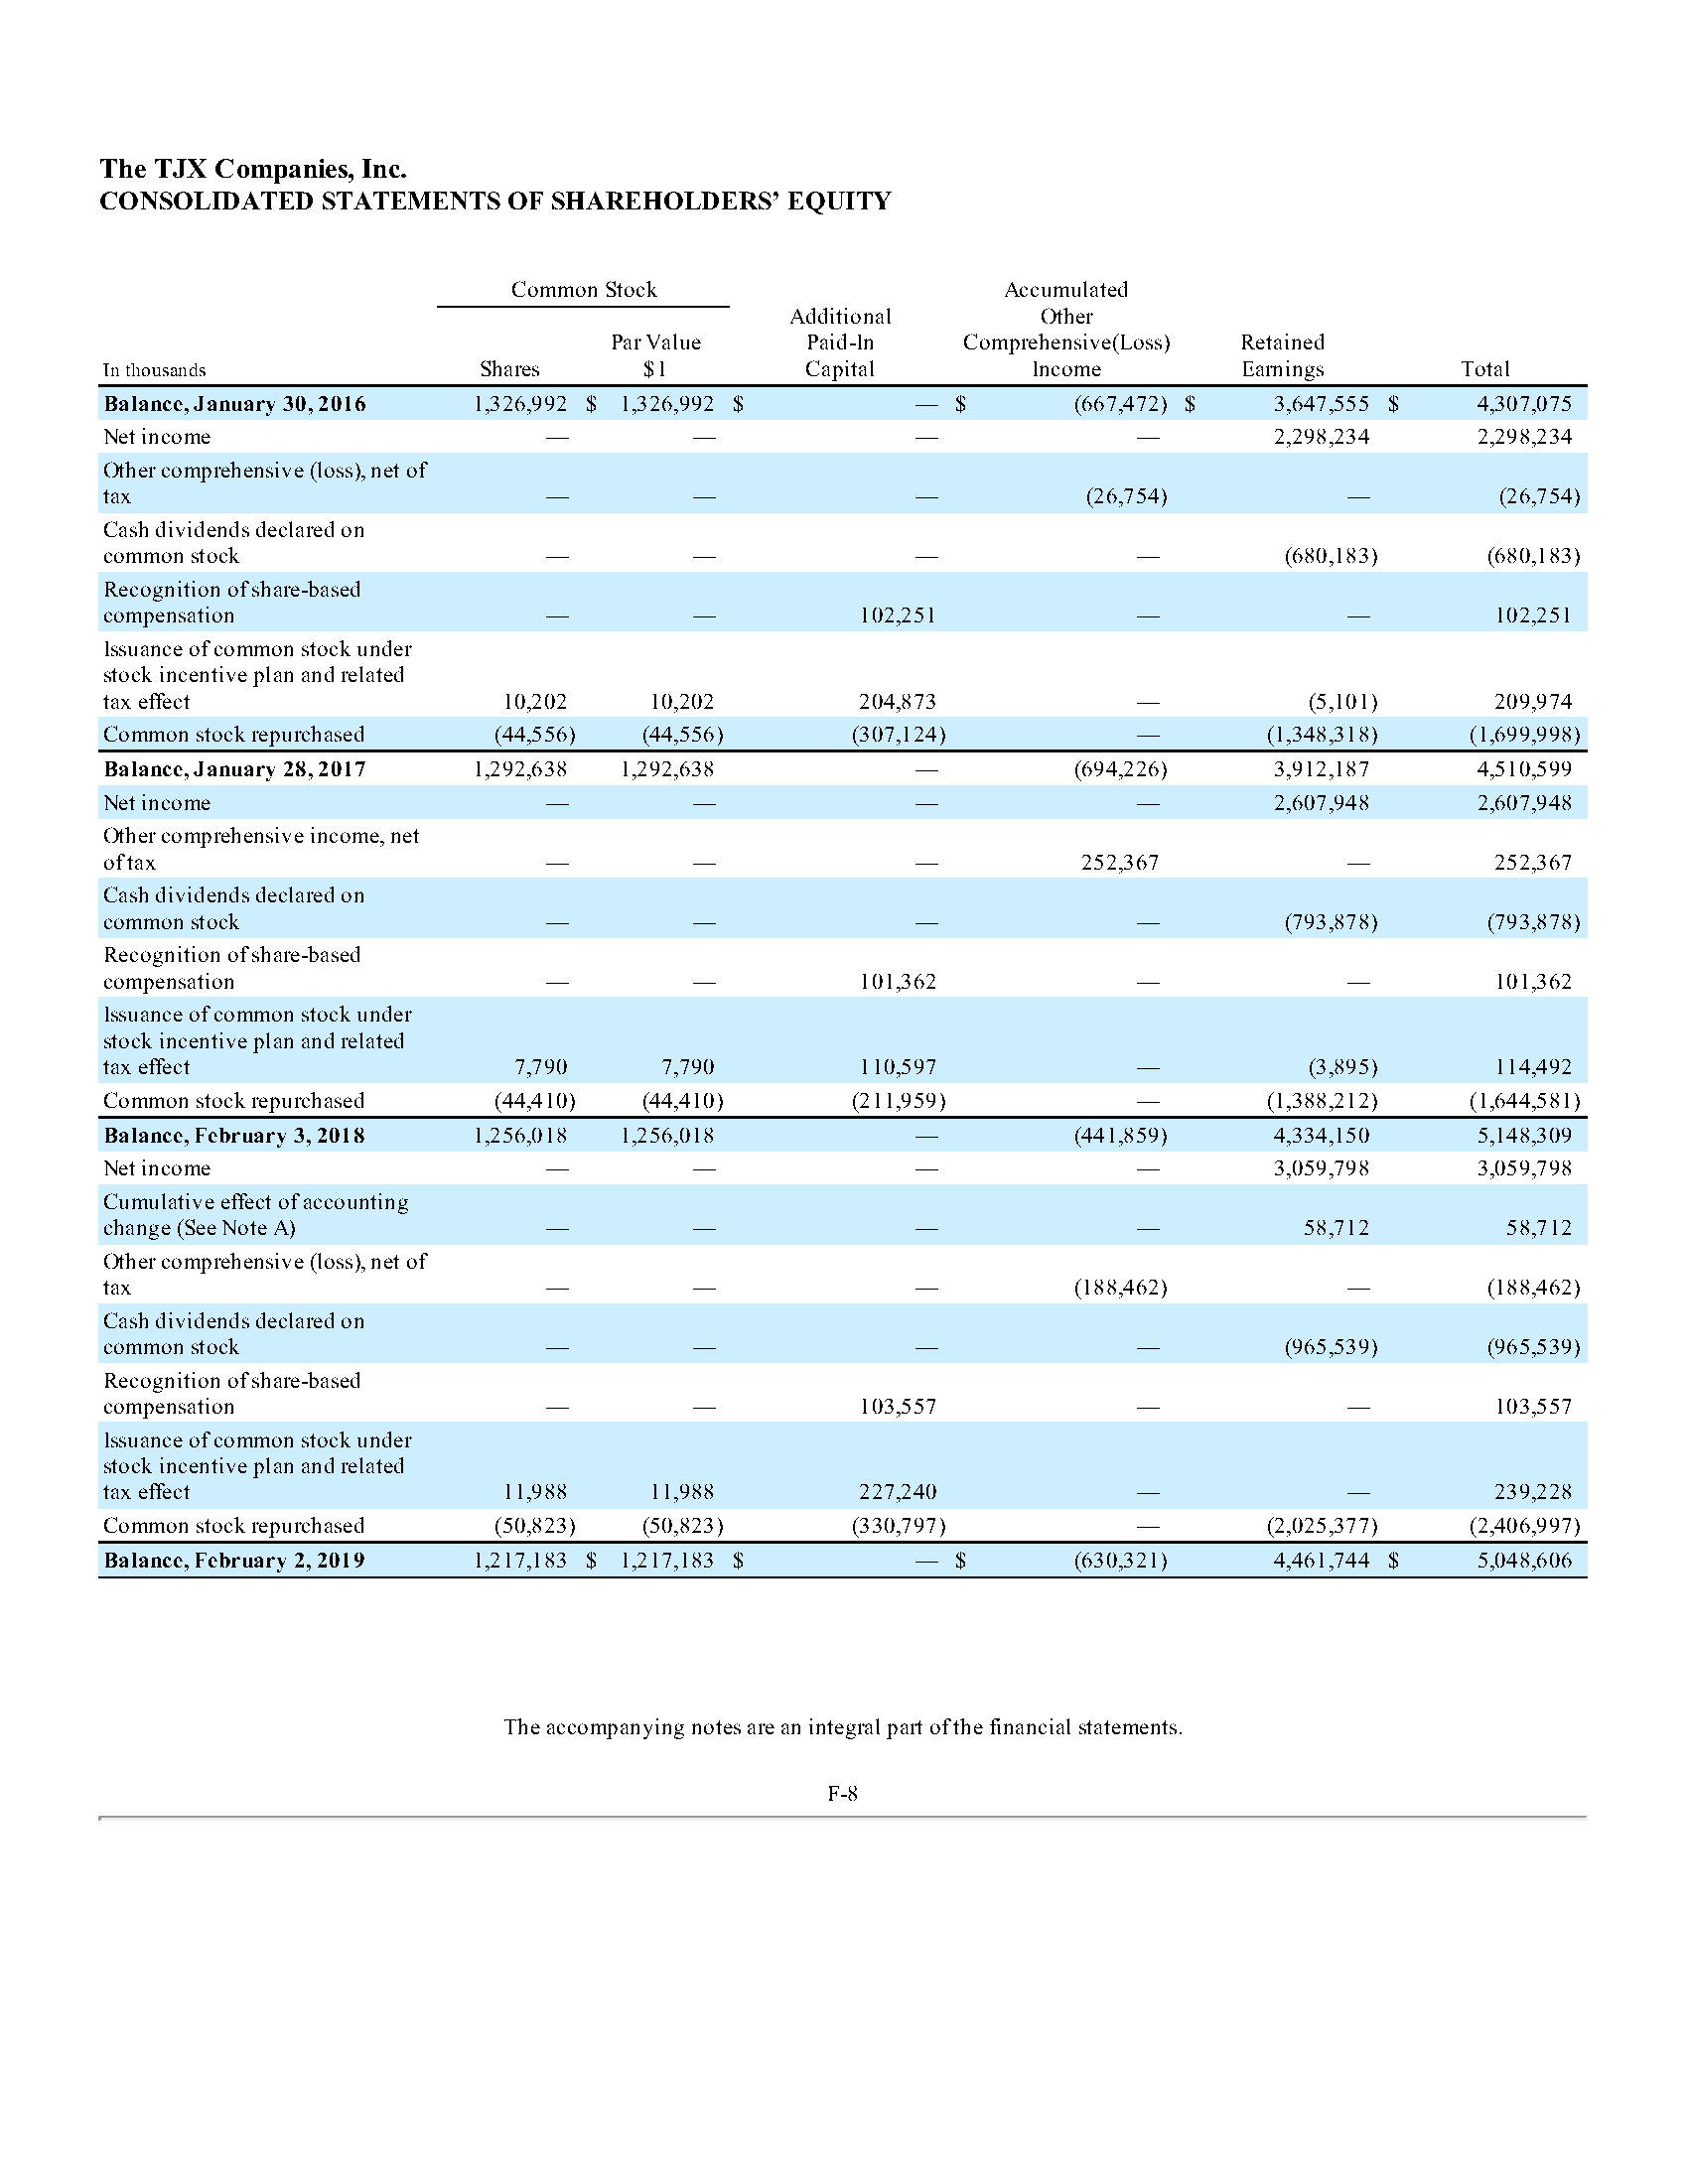
The TJX Companies, Inc. CONSOLIDATED STATEMENTS OF INCOME Fiscal Year Ended February 2 February 3 January 28 Amounts in thousands except per share amounts 2019 2018 2017 53 weeks) Net sales 38,972,934 $ 35,864,664 $ 33,183,744 Cost of sales, including buying and occupancy costs 27,831,177 25,502,167 23,565,754 Selling, general and administrative expenses 6,923,564 6,375,071 5,768,467 Impairment of goodwill and other long-lived assets, related to Sierra 99,250 Loss on early extinguishment of debt 51,773 Pension settlement charge 36,122 31,173 Interest expense, ne ,860 31,588 43,534 Income before provision for income taxes 4,173,211 3,856,588 3,723,043 Provision for income taxes 1,1 13,413 1,248,640 1,424,809 Net income $ 3,059,798 $ 2,607,948 $ 2,298,234 Basic earnings per share: Net income $ 2.47 $ 2.05 $ 1.75 Weighted average common shares - basic 1,241,153 1,273,654 1,31 1,294 Diluted earnings per share: Net income $ 2.43 $ 2.02 $ 1.73 Weighted average common shares - diluted 1,259,252 1,292,209 1,328,864 The accompanying notes are an integral part of the financial statements. F-4The TJX Companies, Inc. CONSOLIDATED STATEMENTS OF COMPREHENSIVE INCOME Fiscal Year Ended February 2 February 3 January 28 In thousands 2019 2018 2017 53 weeks) Net income 3,059,798 $ 2,607,948 $ 2,298,234 Additions to other comprehensive income: Foreign currency translation adjustments, net of related tax benefit of $8,233 in fiscal 2019, and provisions of $36,929 and $25,656 in fiscal 2018 and fiscal 2017, respectively (192,664) 211,752 (52,611) Gain on net investment hedges, net of related tax provision of $7, 1 13 in fiscal 2019 19,538 Recognition of net gains/losses on benefit obligations, net of related tax benefit of $19,813 in fiscal 2019, provision of $8,989 in fiscal 2018 and benefit of $7,394 in fiscal 2017 (54,420) 24,691 (1 1,239) Reclassifications from other comprehensive income to net income: Pension settlement charge, net of related tax provision of $9,641 in fiscal 2019 and $ 12,369 in fiscal 2017 26,481 18,804 Amortization of loss on cash flow hedge, net of related tax provisions of $304, $438 and $450 in fiscal 2019, 2018 and 2017, respectively 847 696 684 Amortization of prior service cost and deferred gains/losses, net of related tax provisions of $4,280, $9,592, and $1 1,584 in fiscal 2019, 2018 and 2017, respectively 11,756 15,228 17.608 Other comprehensive (loss) income, net of tax (188,462) 252,36 26,754) Total comprehensive income $ 71.336 2,860,315 $ 2,271,480 The accompanying notes are an integral part of the financial statements. F-5The TJX Companies, Inc. CONSOLIDATED BALANCE SHEETS Fiscal Year Ended February 2, February 3, Amounts In thousands except share amounts 2019 2018 ASSETS Current assets: Cash and cash equivalents $ 3,030,229 $ 2,758,477 Shortterm investments 7 506,165 Accounts receivable, net 346,298 327,166 Merchandise inventories 4,579,033 4,187,243 Prepaid expenses and other current assets 513,662 706,676 Total current assets 8,469,222 8,485,727 Net property at cost 5,255,208 5,006,053 Non -current deferred income taxes, net 6,467 6,558 Goodwill 97,552 100,069 Other assets 497,580 459,608 TOTAL ASSETS $ 14,326,029 $ 14,058,015 LIABILITIES Current liabilities: Accounts payable $ 2,644,143 $ 2,488,373 Accrued expenses and other current liabilities 2,733,076 2,522,961 Federal, state an d foreign income taxes payable 154,155 114,203 Total current liabilities 5,531,374 5,125,537 Otherlongtermliabilities 1,354,242 1,320,505 Non-current deferred income taxes, net 158,191 233,057 Long-term debt 2,233,616 2,230,607 Commitments and contingencies (See Note L and Note N) SHAREHOLDERS\" EQUITY Preferred stock, authorized 5,000,000 shares, par value $1, no shares issued Common stock, authorized 1,800,000,000 shares, par value $ 1 , issued and outstanding 1,217,182,508 and 1,2561} 18,044, respectively 1,217,183 1,256,018 Additional paid-in capital 7 7 Accumulated othercomprehensive (loss) income (630,321) (441,859) Retained earnings 4,461,744 4,334,150 Total shareholders" equity 5,048,606 5,148,309 TOTAL LIABILITIES AND SHAREHOLDERS' EQUITY $ 14,326,029 $ 14,058,015 The accompanying notes are an integral part ofthe nancial statements. F-6 The TJX Companies, Inc. CONSOLIDATED STATEMENTS OF CASH FLOWS Fiscal Year Ended February 2, February 3. January 28, In thousands 2019 2018 2017 (53 weeks) Cash flows from operating activities: Net income $ 3,059,798 $ 2,607,948 $ 2,298,234 Adjustments to reconcile net income to net cash provided by operating activities: Depreciation and amortization 819,655 725,957 658,796 Loss on property disposals and impairment charges 17,653 8,871 5,207 Deferred income tax (benefit) (88,594) (137,440) (5,503) Share-based compensation 103,557 101,362 102,251 Impairment of goodwill and long-lived assets, related to Sierra 99,250 Loss on early extinguishment of debt 51,773 Pension settlement charge 36,122 31,173 Excess tax benefits from share-based compensation (70,999) Changes in assets and liabilities: (Increase) in accounts receivable (23,532) (62,358) (23,235) (Increase) decrease in merchandise inventories (465,429) (450,377) 11,862 Decrease (increase) in prepaid expenses and other current assets 236,342 (317,850) (9,600) Increase in accounts payable 198,212 205,111 48,253 Increase in accrued expenses and other liabilities 169,418 334,522 389,399 Increase (decrease) in income taxes payable 40,965 (94,492) 146,766 Other (15,708) 5,120 (7,518) Net cash provided by operating activities 4,088,459 3,025,624 3,626,859 Cash flows from investing activities Property additions (1,125,139) (1,057,617) (1,024,747) Purchases of investments (161,625) (861,256) 716,953) Sales and maturities of investments 636,560 906,137 529,146 Other :6,652 2,324) Net cash (used in ) investing activities 623,552) (1,012,736) (1,214,878) Cash flows from financing activities: Proceeds from issuance of long-term debt 992,540 Cash payments for extinguishment of debt (425,584) Cash payments for debt issuance expenses (9,921) Cash payments on build to suit leases (7,115) (3,138) Cash payments for rate lock agreement (3,150) Cash payments for repurchase of common stock (2,406,997) (1,644,581) (1,699,998) Proceeds from issuance of common stock 255,241 133,687 164,190 Cash payments of employee tax withholdings for performance based stock awards (16,014) (19,274) (24,965) Excess tax benefits from share-based compensation 70,999 Cash dividends paid (922,596) (764,040) (650,988) Net cash (used in) financing activities (3,097,481) (2,297,346 (1,586,877) Effect of exchange rate changes on cash (95.674 ) 13,086 9,272 Net increase (decrease) in cash and cash equivalents 271,752 (171,372) 834,376 Cash and cash equivalents at beginning of yea 2,758,477 2,929,849 2,095,473 Cash and cash equivalents at end of year 3,030,229 $ 2,758,477 $ 2,929,849 The accompanying notes are an integral part of the financial statements. F-7The TJX Companies, Inc. CONSOLIDATED STATEMENTS OF SHAREHOLDERS' EQUITY Common Stock Accumulated Additional Other Par Value Paid-In Comprehensive(Loss) Retained In thousands Shares $1 Capital Income Earnings Total Balance, January 30, 2016 1,326,992 $ 1,326,992 $ (667,472) $ 3,647,555 $ 4,307,075 Net income 2,298,234 2,298,234 Other comprehensive (loss), net of ax (26,754) (26,754) Cash dividends declared on common stock (680,183) (680,183) Recognition of share-based compensation 102,251 102,251 Issuance of common stock under and related tax effect 10,202 10,202 204,873 (5,101) 209,974 Common stock repurchased (44,556) (44,556) (307,124) (1,348,318) (1,699,998) Balance, January 28, 2017 1,292,638 1,292,638 (694,226) 3,912,187 4,510,599 Net income 2,607,948 2,607,948 Other comprehensive income, net oftax 252,367 252,367 Cash dividends declared on common stock (793,878) (793,878) Recognition of share-based compensation 101,362 101,362 Issuance of common stock under stock incentive plan and related fax effect 7,790 7,790 1 10,597 (3,895) 114,492 Common stock repurchased (44,410) (44,410) (211,959) (1,388,212) (1,644,581) Balance, February 3, 2018 1,256,018 1,256,018 (441,859) 4,334,150 5,148,309 Net income 3,059,798 3,059,798 Cumulative effect of accounting change (See Note A) - 58,712 58,712 Other comprehensive (loss), net of tax (188,462) (188,462) Cash dividends declared on common stock (965,539) (965,539) Recognition of share-based compensation 103,557 103,557 Issuance of common stock under stock incentive plan and related tax effect 11,988 11,988 227,240 239,228 Common stock repurchased (50,823) (50,823) 330,797) (2,025,377) 2,406,997) Balance, February 2, 2019 ,217,183 $ 1,217,183 $ (630,321) 4,461,744 $ ,048,606 The accompanying notes are an integral part of the financial statements. F-8
Step by Step Solution
There are 3 Steps involved in it
Step: 1
Get Instant Access to Expert-Tailored Solutions
See step-by-step solutions with expert insights and AI powered tools for academic success
Step: 2
Step: 3
Ace Your Homework with AI
Get the answers you need in no time with our AI-driven, step-by-step assistance