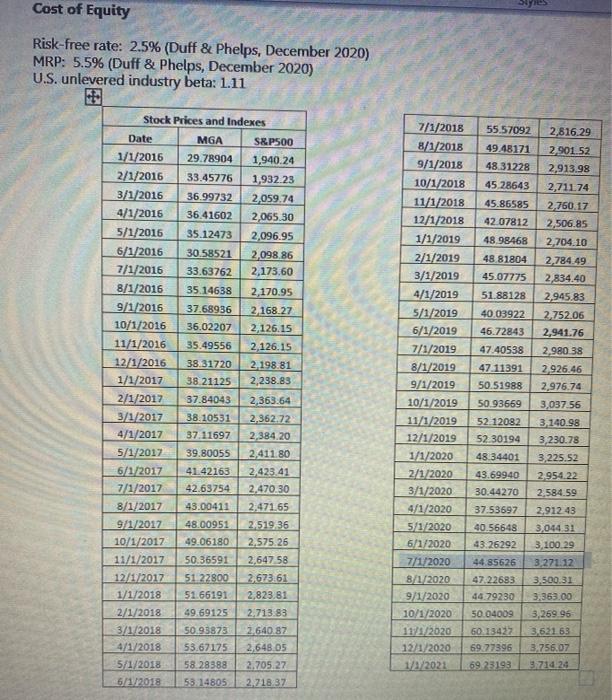
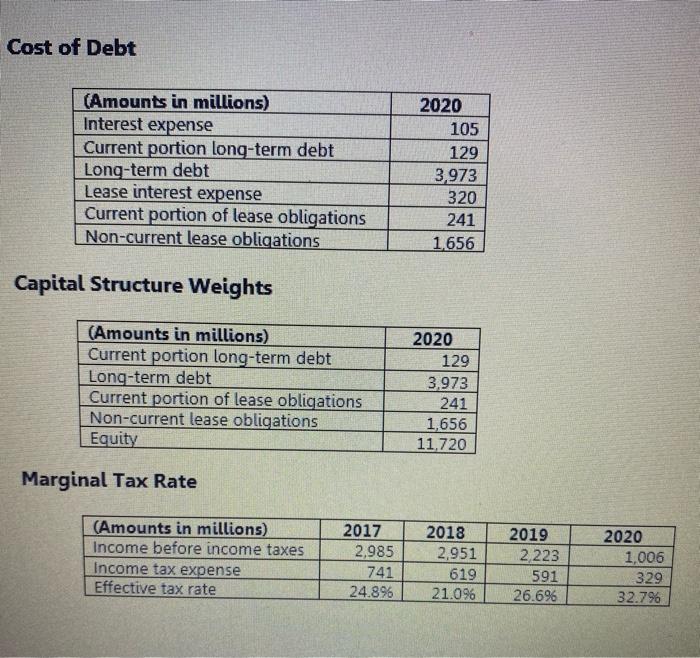
Calculate WACC for 2020. And please show the calculations properly.
Thanks
Cost of Equity Risk-free rate: 2.5% (Duff & Phelps, December 2020) MRP: 5.5% (Duff & Phelps, December 2020) U.S. unlevered industry beta: 1.11 Stock Prices and Indexes Date MGA S&P500 1/1/2016 29.78904 1,940.24 2/1/2016 33.45776 1,932.23 3/1/2016 36.99732 2,059.74 4/1/2016 36.41602 2,065,30 5/1/2016 35.12473 2,096.95 6/1/2016 30.58521 2,098,86 7/1/2016 33.63762 2,173,60 8/1/2016 35.14638 2,170.95 9/1/2016 37.68936 2.168.27 10/1/2016 36.02207 2,126.15 11/1/2016 35.49556 2,126.15 12/1/2016 38.31720 2 198.81 1/1/2017 38.21125 2,238.83 2/1/2017 37.84043 2,363.64 3/1/2017 38.10531 2.362.72 4/1/2017 37.11697 2,384.20 5/1/2017 39.80055 2,411.80 6/1/2017 4142163 2.423.41 7/1/2017 42.63754 2.470.30 8/1/2017 43.00411 2,47165 911/2017 48.00951 24519.36 10/1/2017 49.06180 2,575.26 11/1/2017 50.36591 2.647.58 12/1/2017 51.22800 2673,61 1/1/2018 51.66191 2,823.81 2/1/2018 49.69125 2.713.83 3/1/2018 50.93873 2.640.87 4/1/2018 53.67175 2,648 05 5/1/2018 58 28388 2.705.27 5/1/2018 53. 14805 2.718:37 7/1/2018 55.57092 2,816.29 8/1/2018 49 48171 2,901.52 9/1/2018 48 31228 2,913.98 10/1/2018 45 28643 2,71174 11/1/2018 45.86585 2,760.17 12/1/2018 42 07812 2,506.85 1/1/2019 48.98468 2.704.10 2/1/2019 48 81804 2,784.49 3/1/2019 45.07775 2,834.40 4/1/2019 51.88128 2,945.83 5/1/2019 40 03922 -2.752.06 6/1/2019 46.72843 2,941.76 7/1/2019 47.40538 2,980 38 821/2019 47.11391 2,926.46 9/1/2019 50.51988 2,976.74 10/1/2019 50.93669 3,037.56 11/1/2019 52 12082 3.140.98 12/1/2019 52 30194 3,230.78 1/1/2020 4834401 3,225.52 2/1/2020 43.69940 2954.22 3/1/2020 30.44270 2,584.59 4/1/2020 37.53697 2,91243 5/1/2020 40.56648 3,044.31 6/1/2020 43.26292 3,100.29 7/1/2020 44.85626 3.271.12 8/1/2020 47.22683 3,500.31 9/1/2020 44.79230 3,363.00 10/1/2020 50.04009 3,269.96 11/1/2020 60.13427 3.62163 12/1/2020 69.77396 3.756.07 1/3/2022 69 23193 3714.20 Cost of Debt (Amounts in millions) Interest expense Current portion long-term debt Long-term debt Lease interest expense Current portion of lease obligations Non-current lease obligations 2020 105 129 3,973 320 241 1.656 Capital Structure Weights (Amounts in millions) Current portion long-term debt Long-term debt Current portion of lease obligations Non-current lease obligations Equity 2020 129 3.973 241 1,656 11.720 Marginal Tax Rate (Amounts in millions) Income before income taxes Income tax expense Effective tax rate 2017 2,985 741 24.896 2018 2,951 619 21.096 2019 2,223 591 26.696 2020 1,006 329 32.796 Cost of Equity Risk-free rate: 2.5% (Duff & Phelps, December 2020) MRP: 5.5% (Duff & Phelps, December 2020) U.S. unlevered industry beta: 1.11 Stock Prices and Indexes Date MGA S&P500 1/1/2016 29.78904 1,940.24 2/1/2016 33.45776 1,932.23 3/1/2016 36.99732 2,059.74 4/1/2016 36.41602 2,065,30 5/1/2016 35.12473 2,096.95 6/1/2016 30.58521 2,098,86 7/1/2016 33.63762 2,173,60 8/1/2016 35.14638 2,170.95 9/1/2016 37.68936 2.168.27 10/1/2016 36.02207 2,126.15 11/1/2016 35.49556 2,126.15 12/1/2016 38.31720 2 198.81 1/1/2017 38.21125 2,238.83 2/1/2017 37.84043 2,363.64 3/1/2017 38.10531 2.362.72 4/1/2017 37.11697 2,384.20 5/1/2017 39.80055 2,411.80 6/1/2017 4142163 2.423.41 7/1/2017 42.63754 2.470.30 8/1/2017 43.00411 2,47165 911/2017 48.00951 24519.36 10/1/2017 49.06180 2,575.26 11/1/2017 50.36591 2.647.58 12/1/2017 51.22800 2673,61 1/1/2018 51.66191 2,823.81 2/1/2018 49.69125 2.713.83 3/1/2018 50.93873 2.640.87 4/1/2018 53.67175 2,648 05 5/1/2018 58 28388 2.705.27 5/1/2018 53. 14805 2.718:37 7/1/2018 55.57092 2,816.29 8/1/2018 49 48171 2,901.52 9/1/2018 48 31228 2,913.98 10/1/2018 45 28643 2,71174 11/1/2018 45.86585 2,760.17 12/1/2018 42 07812 2,506.85 1/1/2019 48.98468 2.704.10 2/1/2019 48 81804 2,784.49 3/1/2019 45.07775 2,834.40 4/1/2019 51.88128 2,945.83 5/1/2019 40 03922 -2.752.06 6/1/2019 46.72843 2,941.76 7/1/2019 47.40538 2,980 38 821/2019 47.11391 2,926.46 9/1/2019 50.51988 2,976.74 10/1/2019 50.93669 3,037.56 11/1/2019 52 12082 3.140.98 12/1/2019 52 30194 3,230.78 1/1/2020 4834401 3,225.52 2/1/2020 43.69940 2954.22 3/1/2020 30.44270 2,584.59 4/1/2020 37.53697 2,91243 5/1/2020 40.56648 3,044.31 6/1/2020 43.26292 3,100.29 7/1/2020 44.85626 3.271.12 8/1/2020 47.22683 3,500.31 9/1/2020 44.79230 3,363.00 10/1/2020 50.04009 3,269.96 11/1/2020 60.13427 3.62163 12/1/2020 69.77396 3.756.07 1/3/2022 69 23193 3714.20 Cost of Debt (Amounts in millions) Interest expense Current portion long-term debt Long-term debt Lease interest expense Current portion of lease obligations Non-current lease obligations 2020 105 129 3,973 320 241 1.656 Capital Structure Weights (Amounts in millions) Current portion long-term debt Long-term debt Current portion of lease obligations Non-current lease obligations Equity 2020 129 3.973 241 1,656 11.720 Marginal Tax Rate (Amounts in millions) Income before income taxes Income tax expense Effective tax rate 2017 2,985 741 24.896 2018 2,951 619 21.096 2019 2,223 591 26.696 2020 1,006 329 32.796


