Calculate Walmarts cost of long-term debt using both the yield- to-maturity and spread methods. Clearly and concisely show your calculations and state any assumptions
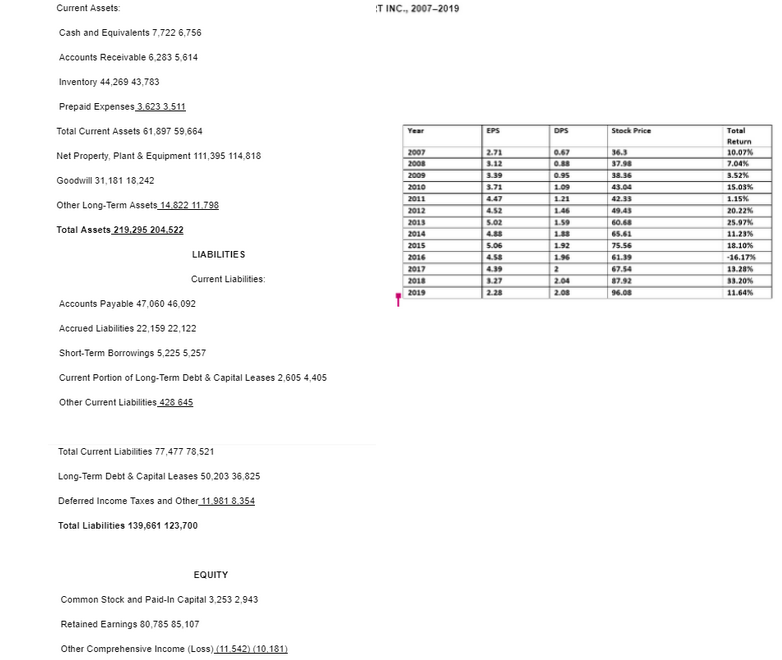
Current Assets: Cash and Equivalents 7,722 6,756 Accounts Receivable 6,283 5,614 Inventory 44,269 43,783 Prepaid Expenses 3.623 3.511 Total Current Assets 61,897 59,664 Net Property, Plant & Equipment 111,395 114,818 Goodwill 31,181 18,242 Other Long-Term Assets 14.822 11.798 Total Assets 219,295 204,522 LIABILITIES Current Liabilities: Accounts Payable 47,060 46,092 Accrued Liabilities 22,159 22,122 Short-Term Borrowings 5,225 5,257 Current Portion of Long-Term Debt & Capital Leases 2,605 4,405 Other Current Liabilities 428 645 Total Current Liabilities 77,477 78,521 Long-Term Debt & Capital Leases 50,203 36,825 Deferred Income Taxes and Other 11.981 8.354 Total Liabilities 139,661 123,700 EQUITY Common Stock and Paid-In Capital 3,253 2,943 Retained Earnings 80,785 85,107 Other Comprehensive Income (Loss) (11.542) (10.181) IT INC., 2007-2019 Year 2007 2008 2009 2010 2011 2012 2013 2014 2015 2016 2017 2018 2019 EPS 2.71 3.12 3.39 3.71 4.52 5.02 4.85 5.06 3.27 2.28 DPS 0.67 0.88 0.95 1.09 1.21 1.46 1.59 1.88 1.92 1.96 2 2.04 2.08 Stock Price 36.3 37.98 38.36 43.04 42.33 49.43 60.68 65.61 75.56 61.39 67.54 87.92 96.08 Total Return 10.07% 7.04% 3.52% 15.03% 1.15% 20.22% 25.97% 11.23% 18.10% -16.17% 13.28% 33.20% 11.64% Current Assets: Cash and Equivalents 7,722 6,756 Accounts Receivable 6,283 5,614 Inventory 44,269 43,783 Prepaid Expenses 3.623 3.511 Total Current Assets 61,897 59,664 Net Property, Plant & Equipment 111,395 114,818 Goodwill 31,181 18,242 Other Long-Term Assets 14.822 11.798 Total Assets 219,295 204,522 LIABILITIES Current Liabilities: Accounts Payable 47,060 46,092 Accrued Liabilities 22,159 22,122 Short-Term Borrowings 5,225 5,257 Current Portion of Long-Term Debt & Capital Leases 2,605 4,405 Other Current Liabilities 428 645 Total Current Liabilities 77,477 78,521 Long-Term Debt & Capital Leases 50,203 36,825 Deferred Income Taxes and Other 11.981 8.354 Total Liabilities 139,661 123,700 EQUITY Common Stock and Paid-In Capital 3,253 2,943 Retained Earnings 80,785 85,107 Other Comprehensive Income (Loss) (11.542) (10.181) IT INC., 2007-2019 Year 2007 2008 2009 2010 2011 2012 2013 2014 2015 2016 2017 2018 2019 EPS 2.71 3.12 3.39 3.71 4.52 5.02 4.85 5.06 3.27 2.28 DPS 0.67 0.88 0.95 1.09 1.21 1.46 1.59 1.88 1.92 1.96 2 2.04 2.08 Stock Price 36.3 37.98 38.36 43.04 42.33 49.43 60.68 65.61 75.56 61.39 67.54 87.92 96.08 Total Return 10.07% 7.04% 3.52% 15.03% 1.15% 20.22% 25.97% 11.23% 18.10% -16.17% 13.28% 33.20% 11.64%


