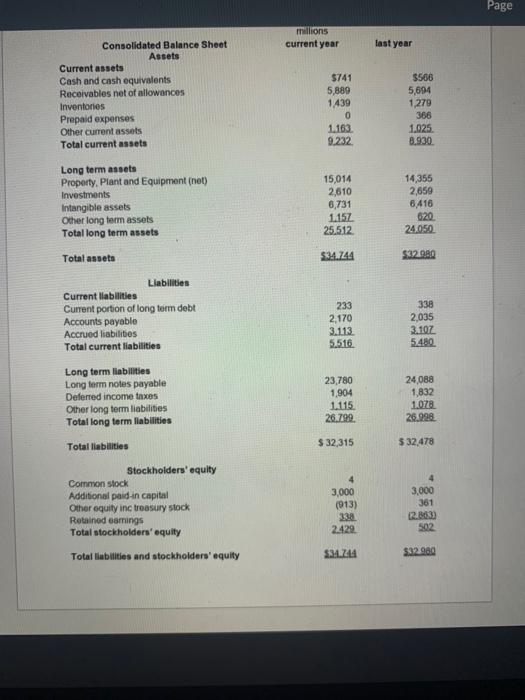
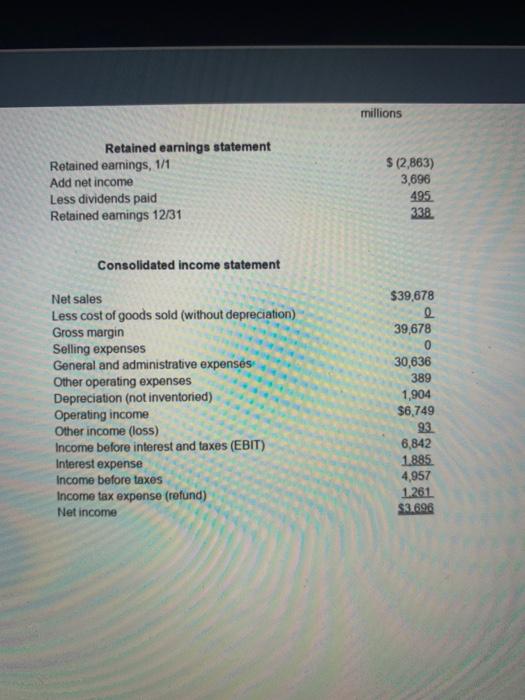
Calculated metrics for Sampled firm #1 using balance sheet and income statement: working capital average income tax rate Inventory tumover days' sales in inventory receivables turnover days' sales in receivables payables turnover days' cost in payables cash cycle average tax rate assets turnover capital intensity ratio ROA ROE Page millions current year last year Consolidated Balance Sheet Assets Current assets Cash and cash equivalents Receivables net of allowances Inventorios Prepaid expenses Other current assets Total current assets $741 5,889 1,439 0 1.163 9.232 $506 5,694 1,279 366 1.025. 8.930 Long term assets Property, Plant and Equipment (net) Investments Intangible assets Other long term assets Total long term assets 15,014 2,610 6,731 1.157 25,512 14,355 2,659 8416 620 24.050 $34.744 $32.980 Total asseto Llabilities Current liabilities Current portion of long term debt Accounts payable Accrued liabilities Total current liabilities 233 2,170 3.113 5,516 338 2,035 3.10Z 5.480 Long term liabilities Longform notes payable Deferred income taxes Other long term liabilities Total long term liabilities 23,780 1.904 1.115 26.799 24,088 1,832 1.078 26.998 Total liabilities $ 32,315 $32.478 Stockholders' equity Common stock Additional paid-in capital Other equity inc treasury stock Retained earnings Total stockholders' equity 4 3,000 (913) 338 2.429 4 3,000 361 12.8833 502 Total liabilities and stockholders' equity $34.74 $32.960 millions Retained earnings statement Retained earings, 1/1 Add net income Less dividends paid Retained earnings 12/31 $(2,863) 3,696 495 338 Consolidated income statement Net sales Less cost of goods sold (without depreciation) Gross margin Selling expenses General and administrative expenses Other operating expenses Depreciation (not inventoried) Operating income Other income (loss) Income before interest and taxes (EBIT) Interest expense Income before taxes Income tax expense (refund) Net income $39,678 e 39,678 0 30,636 389 1,904 $6.749 93. 6,842 1.885 4,957 1.261 $3.696 Calculated metrics for Sampled firm #1 using balance sheet and income statement: working capital average income tax rate Inventory tumover days' sales in inventory receivables turnover days' sales in receivables payables turnover days' cost in payables cash cycle average tax rate assets turnover capital intensity ratio ROA ROE Page millions current year last year Consolidated Balance Sheet Assets Current assets Cash and cash equivalents Receivables net of allowances Inventorios Prepaid expenses Other current assets Total current assets $741 5,889 1,439 0 1.163 9.232 $506 5,694 1,279 366 1.025. 8.930 Long term assets Property, Plant and Equipment (net) Investments Intangible assets Other long term assets Total long term assets 15,014 2,610 6,731 1.157 25,512 14,355 2,659 8416 620 24.050 $34.744 $32.980 Total asseto Llabilities Current liabilities Current portion of long term debt Accounts payable Accrued liabilities Total current liabilities 233 2,170 3.113 5,516 338 2,035 3.10Z 5.480 Long term liabilities Longform notes payable Deferred income taxes Other long term liabilities Total long term liabilities 23,780 1.904 1.115 26.799 24,088 1,832 1.078 26.998 Total liabilities $ 32,315 $32.478 Stockholders' equity Common stock Additional paid-in capital Other equity inc treasury stock Retained earnings Total stockholders' equity 4 3,000 (913) 338 2.429 4 3,000 361 12.8833 502 Total liabilities and stockholders' equity $34.74 $32.960 millions Retained earnings statement Retained earings, 1/1 Add net income Less dividends paid Retained earnings 12/31 $(2,863) 3,696 495 338 Consolidated income statement Net sales Less cost of goods sold (without depreciation) Gross margin Selling expenses General and administrative expenses Other operating expenses Depreciation (not inventoried) Operating income Other income (loss) Income before interest and taxes (EBIT) Interest expense Income before taxes Income tax expense (refund) Net income $39,678 e 39,678 0 30,636 389 1,904 $6.749 93. 6,842 1.885 4,957 1.261 $3.696


