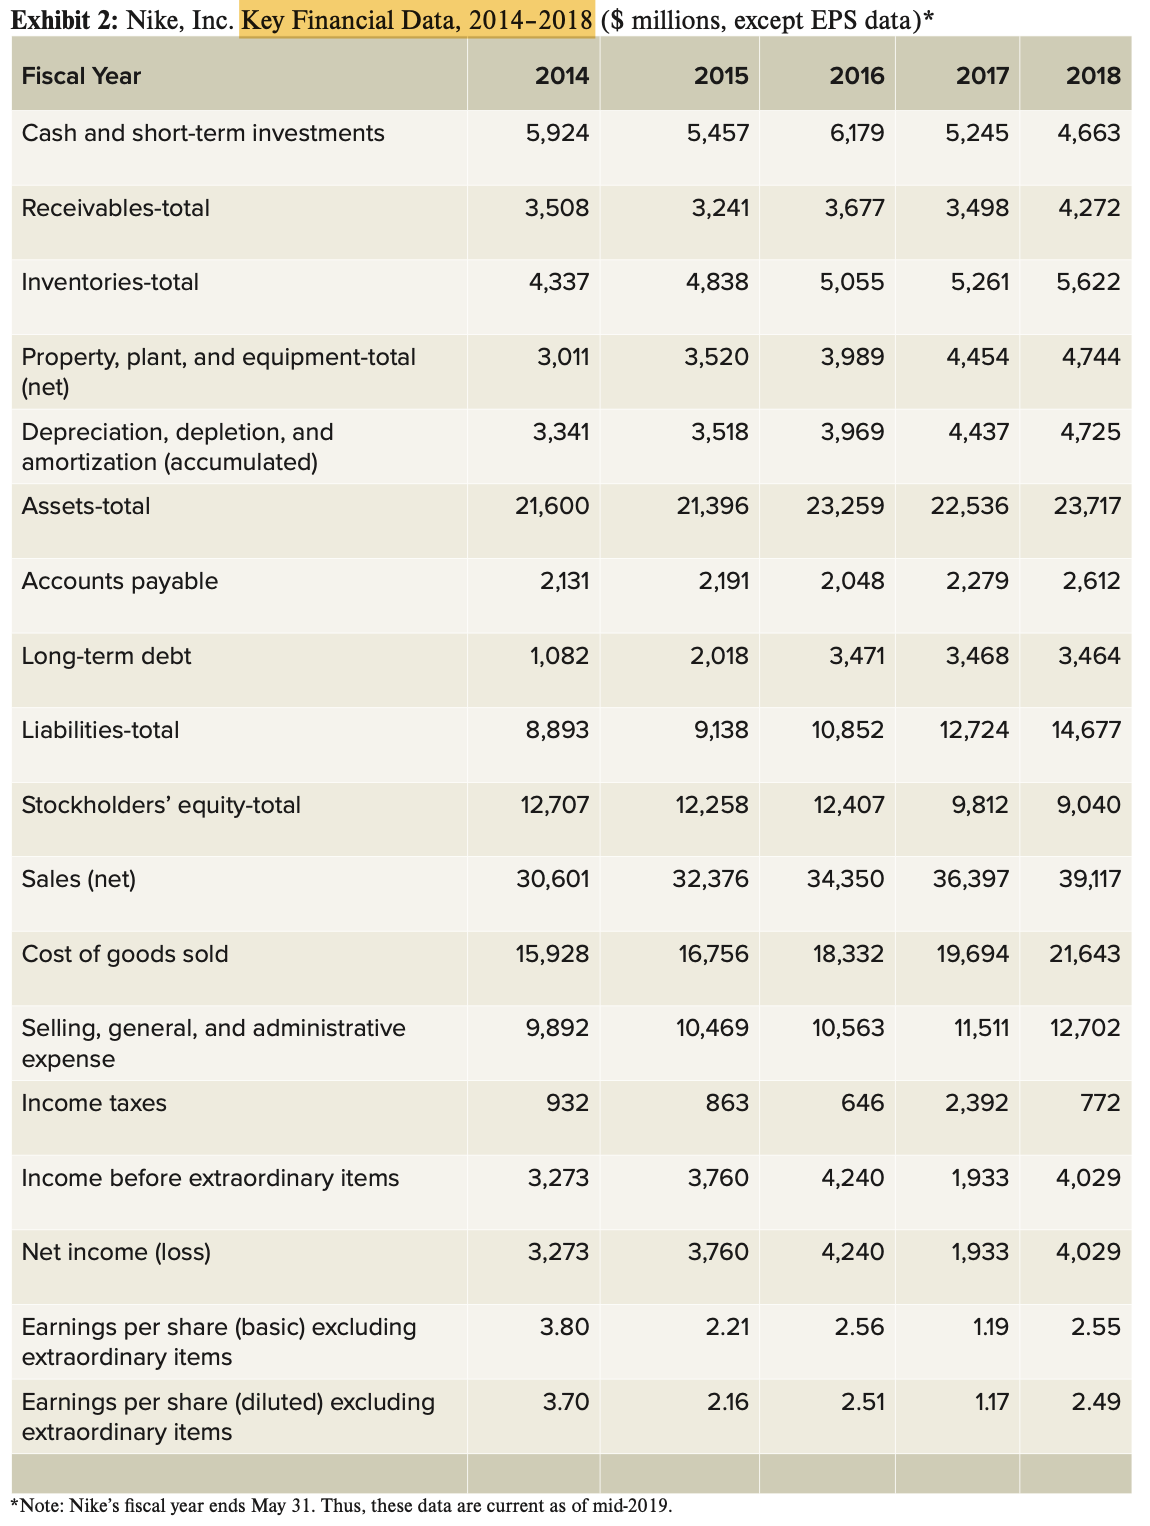
calculated revenue and profitability for Nike from 2014 to 2018. Exhibit 2: Nike, Inc. Key Financial Data, 2014-2018 ($ millions, except EPS data)* Fiscal Year

Exhibit 2: Nike, Inc. Key Financial Data, 2014-2018 ($ millions, except EPS data)* Fiscal Year Cash and short-term investments Receivables-total Inventories-total Property, plant, and equipment-total (net) Depreciation, depletion, and amortization (accumulated) Assets-total Accounts payable Long-term debt Liabilities-total Stockholders' equity-total Sales (net) Cost of goods sold Selling, general, and administrative expense Income taxes Income before extraordinary items Net income (loss) Earnings per share (basic) excluding extraordinary items Earnings per share (diluted) excluding extraordinary items 2014 5,924 3,508 4,337 3,011 3,341 21,600 2,131 1,082 8,893 12,707 30,601 15,928 9,892 932 3,273 3,273 3.80 3.70 2015 *Note: Nike's fiscal year ends May 31. Thus, these data are current as of mid-2019. 5,457 3,241 4,838 3,520 3,518 2,191 2,018 9,138 12,258 16,756 10,469 863 3,760 3,760 2016 2.21 6,179 2.16 3,677 5,055 32,376 34,350 3,989 3,969 21,396 23,259 22,536 23,717 3,471 10,852 12,407 2,048 2,279 18,332 10,563 646 4,240 4,240 2017 5,245 4,663 2.56 3,498 2.51 5,261 4,454 4,437 3,468 36,397 19,694 2018 4,272 2,392 5,622 4,744 12,724 14,677 4,725 9,812 9,040 1.19 1.17 2,612 3,464 11,511 12,702 39,117 21,643 1,933 4,029 772 1,933 4,029 2.55 2.49
Step by Step Solution
3.45 Rating (152 Votes )
There are 3 Steps involved in it
Step: 1
To calculate revenue and profitability for Nike from 2014 to 2018 we will focus on the following key financial data 1 Sales net This represents the to...
See step-by-step solutions with expert insights and AI powered tools for academic success
Step: 2

Step: 3

Ace Your Homework with AI
Get the answers you need in no time with our AI-driven, step-by-step assistance
Get Started


