Answered step by step
Verified Expert Solution
Question
1 Approved Answer
Calculating using Monte Carlo Problem Setup The Monte Carlo method is commonly used to approximate areas or volumes of shapes. In this problem, we will

Calculating using Monte Carlo
Problem Setup
The Monte Carlo method is commonly used to approximate areas or volumes of shapes. In this problem, we will use Monte Carlo to find the area of a circle, allowing us to estimate the value of . Furthermore, we will use several different sample sizes to see how the accuracy increases with larger samples.
( def function& establish pi &plot error)
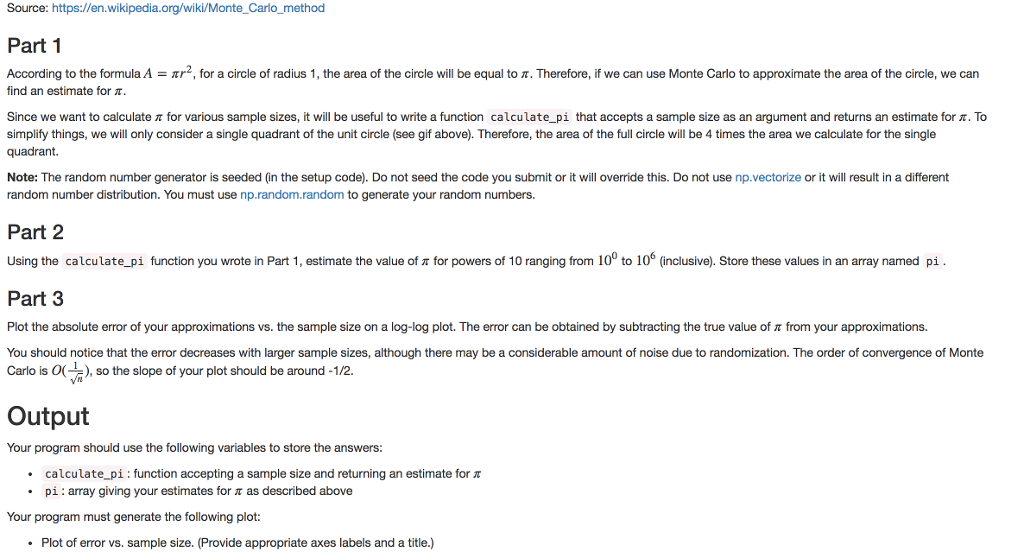
Source: https://en.wikipedia.org/wiki/Monte_Carlo_method Part 1 r2 for a circle of radius ircle will be equal . There re if we can use Monte Car to approximate the area of According to the ormula find an estimate for . the area o he Circie we can Since we want o calculate or various sample sizes, t w be useful to write a unction calcu ate pl that accepts a sample Size as an ument and returns an estimate or simplify things, we will only consider a single quadrant of the unit circle (see gif above). Therefore, the area of the full circle will be 4 times the area we calculate for the single quadrant. Note: The random number generator is seeded (in the setup code). Do not seed the code you submit or it will override this. Do not use np.vectorize or it will result in a different random number distribution. You must use np.random.random to generate your random numbers. Part 2 Using the calculate-pi function you wrote in Part 1 , estimate the value of for powers of 10 ranging from 100 to 106 (inclusive). Store these values in an array named pi Part 3 Plot the absolute error of your approximations vs. the sample size on a log-log plot. The error can be obtained by subtracting the true value of from your approximations. You should notice that the error decreases with larger sample sizes, although there may be a considerable amount of noise due to randomization. The order of convergence of Monte Carlo is 0( ), so the slope of your plot should be around-1/2. Output Your program should use the following variables to store the answers calculate-pi : function accepting a sample size and returning an estimate for pi : array giving your estimates for as described above Your program must generate the following plot: Plot of error vs. sample size. (Provide appropriate axes labels and a title.) Source: https://en.wikipedia.org/wiki/Monte_Carlo_method Part 1 r2 for a circle of radius ircle will be equal . There re if we can use Monte Car to approximate the area of According to the ormula find an estimate for . the area o he Circie we can Since we want o calculate or various sample sizes, t w be useful to write a unction calcu ate pl that accepts a sample Size as an ument and returns an estimate or simplify things, we will only consider a single quadrant of the unit circle (see gif above). Therefore, the area of the full circle will be 4 times the area we calculate for the single quadrant. Note: The random number generator is seeded (in the setup code). Do not seed the code you submit or it will override this. Do not use np.vectorize or it will result in a different random number distribution. You must use np.random.random to generate your random numbers. Part 2 Using the calculate-pi function you wrote in Part 1 , estimate the value of for powers of 10 ranging from 100 to 106 (inclusive). Store these values in an array named pi Part 3 Plot the absolute error of your approximations vs. the sample size on a log-log plot. The error can be obtained by subtracting the true value of from your approximations. You should notice that the error decreases with larger sample sizes, although there may be a considerable amount of noise due to randomization. The order of convergence of Monte Carlo is 0( ), so the slope of your plot should be around-1/2. Output Your program should use the following variables to store the answers calculate-pi : function accepting a sample size and returning an estimate for pi : array giving your estimates for as described above Your program must generate the following plot: Plot of error vs. sample size. (Provide appropriate axes labels and a title.)Step by Step Solution
There are 3 Steps involved in it
Step: 1

Get Instant Access to Expert-Tailored Solutions
See step-by-step solutions with expert insights and AI powered tools for academic success
Step: 2

Step: 3

Ace Your Homework with AI
Get the answers you need in no time with our AI-driven, step-by-step assistance
Get Started


